Vodafone 2006 Annual Report Download - page 110
Download and view the complete annual report
Please find page 110 of the 2006 Vodafone annual report below. You can navigate through the pages in the report by either clicking on the pages listed below, or by using the keyword search tool below to find specific information within the annual report.-
 1
1 -
2
-
3
-
4
-
5
-
6
-
7
-
8
-
9
-
10
-
11
-
12
-
13
-
14
-
15
-
16
-
17
-
18
-
19
-
20
-
21
-
22
-
23
-
24
-
25
-
26
-
27
-
28
-
29
-
30
-
31
-
32
-
33
-
34
-
35
-
36
-
37
-
38
-
39
-
40
-
41
-
42
-
43
-
44
-
45
-
46
-
47
-
48
-
49
-
50
-
51
-
52
-
53
-
54
-
55
-
56
-
57
-
58
-
59
-
60
-
61
-
62
-
63
-
64
-
65
-
66
-
67
-
68
-
69
-
70
-
71
-
72
-
73
-
74
-
75
-
76
-
77
-
78
-
79
-
80
-
81
-
82
-
83
-
84
-
85
-
86
-
87
-
88
-
89
-
90
-
91
-
92
-
93
-
94
-
95
-
96
-
97
-
98
-
99
-
 100
100 -
 101
101 -
 102
102 -
 103
103 -
 104
104 -
 105
105 -
 106
106 -
 107
107 -
 108
108 -
 109
109 -
 110
110 -
 111
111 -
 112
112 -
 113
113 -
 114
114 -
 115
115 -
 116
116 -
 117
117 -
 118
118 -
 119
119 -
 120
120 -
121
-
122
-
123
-
124
-
125
-
126
-
127
-
128
-
129
-
130
-
131
-
132
-
133
-
134
-
135
-
136
-
137
-
138
-
139
-
140
-
141
-
142
-
143
-
144
-
145
-
146
-
147
-
148
-
149
-
150
-
151
-
152
 |
 |

108 Vodafone Group Plc Annual Report 2006
Notes to the Consolidated Financial Statements
continued
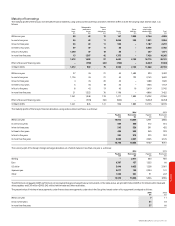
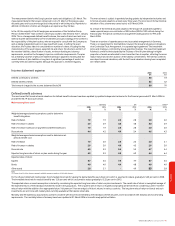
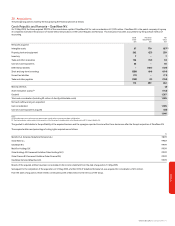
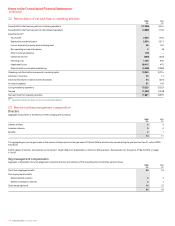
25. Post employment benefits continued
Charges made to the consolidated income statement and consolidated statement of recognised income and expense on the basis of the assumptions stated above:
Germany UK Other Total
2006 2005 2006 2005 2006 2005 2006 2005
£m £m £m £m £m £m £m £m
Current service cost 7638 37 12 10 57 53
Interest cost 10 936 26 6652 41
Expected return on scheme assets (9) (8) (44) (31) (4) (3) (57) (42)
Total included within staff costs (note 34) 8730 32 14 13 52 52
Consolidated statement of recognised
income and expense:
Total actuarial (gains)/losses recognised in
consolidated statement of recognised
income and expense (5) 20 56 72 (8) 10 43 102
All actuarial gains and losses are recognised immediately.
Figures relating to the income statement are for continuing operations only.
The cumulative recognised actuarial losses for Germany, the UK and the other schemes was £15 million, £128 million and £2 million respectively.
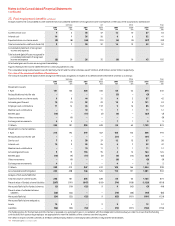
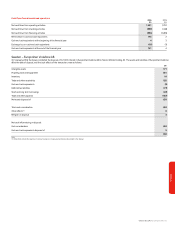
Fair value of the assets and liabilities of the schemes
The amount included in the balance sheet arising from the Group’s obligations in respect of its defined benefit retirement schemes is as follows:
Germany UK Other Total
2006 2005 2006 2005 2006 2005 2006 2005
£m £m £m £m £m £m £m £m
Movement in assets:
1 April 181 165 628 433 65 42 874 640
Reclassification as held for sale ––––(3) –(3) –
Expected return on scheme assets 9844 31 4357 42
Actuarial gains/(losses) 10 (1) 99 23 12 2121 24
Employer cash contributions 11 14 65 137 916 85 167
Member cash contributions ––10 11 1111 12
Benefits paid (10) – (11) (7) (6) –(27) (7)
Other movements –(9) –––––(9)
Exchange rate movements 44––1155
31 March 205 181 835 628 83 65 1,123 874
Movement in scheme liabilities:
1 April 213 192 619 457 166 145 998 794
Reclassification as held for sale ––––(31) –(31) –
Service cost 7638 37 12 15 57 58
Interest cost 10 936 26 6752 42
Member cash contributions ––10 11 1111 12
Actuarial (gains)/losses 519 155 95 412 164 126
Benefits paid (10) (9) (11) (7) (6) (14) (27) (30)
Other movements –(9) ––(8) –(8) (9)
Exchange rate movements 45––4–85
31 March 229 213 847 619 148 166 1,224 998
Accumulated benefit obligation 222 208 746 545 113 151 1,081 904
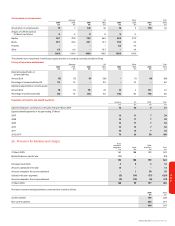
Analysis of net assets/(deficits):
Total fair value of scheme assets 205 181 835 628 83 65 1,123 874
Present value of funded scheme liabilities (207) (191) (847) (619) (74) (108) (1,128) (918)
Net assets/(deficits) for funded schemes (2) (10) (12) 99(43) (5) (44)
Present value of unfunded scheme
liabilities (22) (22) ––(74) (58) (96) (80)
Net assets/(deficits) (24) (32) (12) 9(65) (101) (101) (124)
Net assets/(deficits) are analysed as:
Assets 10 3–99–19 12
Liabilities (34) (35) (12) –(74) (101) (120) (136)
The funding policy for the German and UK schemes is reviewed on a systematic basis in consultation with the independent scheme actuary in order to ensure that the funding
contributions from sponsoring employers are appropriate to meet the liabilities of the schemes over the long term.
The deficit in respect of other schemes at 31 March 2006 primarily relates to internally funded schemes in Italy and the United States.