Vodafone 2006 Annual Report Download - page 32
Download and view the complete annual report
Please find page 32 of the 2006 Vodafone annual report below. You can navigate through the pages in the report by either clicking on the pages listed below, or by using the keyword search tool below to find specific information within the annual report.-
 1
1 -
2
-
3
-
4
-
5
-
6
-
7
-
8
-
9
-
10
-
11
-
12
-
13
-
14
-
15
-
16
-
17
-
18
-
19
-
20
-
21
-
 22
22 -
 23
23 -
 24
24 -
 25
25 -
 26
26 -
 27
27 -
 28
28 -
 29
29 -
 30
30 -
 31
31 -
 32
32 -
 33
33 -
 34
34 -
 35
35 -
 36
36 -
 37
37 -
 38
38 -
 39
39 -
 40
40 -
 41
41 -
 42
42 -
43
-
44
-
45
-
46
-
47
-
48
-
49
-
50
-
51
-
52
-
53
-
54
-
55
-
56
-
57
-
58
-
59
-
60
-
61
-
62
-
63
-
64
-
65
-
66
-
67
-
68
-
69
-
70
-
71
-
72
-
73
-
74
-
75
-
76
-
77
-
78
-
79
-
80
-
81
-
82
-
83
-
84
-
85
-
86
-
87
-
88
-
89
-
90
-
91
-
92
-
93
-
94
-
95
-
96
-
97
-
98
-
99
-
100
-
101
-
102
-
103
-
104
-
105
-
106
-
107
-
108
-
109
-
110
-
111
-
112
-
113
-
114
-
115
-
116
-
117
-
118
-
119
-
120
-
121
-
122
-
123
-
124
-
125
-
126
-
127
-
128
-
129
-
130
-
131
-
132
-
133
-
134
-
135
-
136
-
137
-
138
-
139
-
140
-
141
-
142
-
143
-
144
-
145
-
146
-
147
-
148
-
149
-
150
-
151
-
152
 |
 |

30 Vodafone Group Plc Annual Report 2006
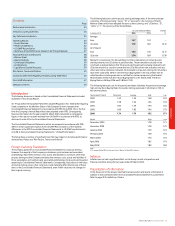
Operating Results
2006 financial year compared to 2005 financial year
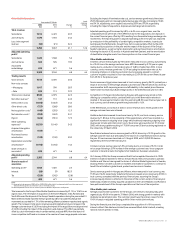
Revenue increased by 10.0% to £29,350 million in the year to 31 March 2006, resulting
from organic growth of 7.5%, favourable movements in exchange rates of 0.5% and a
further 2.0% from the acquisitions in the Czech Republic, India, Romania and South
Africa, partially offset by the impact of the disposal of the Group’s operations in Sweden.
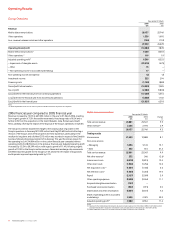
The Group recorded an impairment charge to the carrying value of goodwill in the
Group’s operations in Germany (£19,400 million) and Italy (£3,600 million) reflecting a
revision of the Group’s view of the prospects for these businesses, particularly in the
medium to long term, and a further £515 million was recorded in respect of the Swedish
business following the announcement of its disposal. This was the primary reason for
the operating loss of £14,084 million in the current financial year compared with an
operating profit of £7,878 million in the previous financial year. Adjusted operating profit
increased by 12.5% to £9,399 million, with organic growth of 11.4%, following organic
growth of 10.3% in the Group’s mobile business. Favourable exchange rate movements
benefited reported growth for the Group by 1.0% whilst the net impact of acquisitions
and disposals improved reported growth by 0.1%.
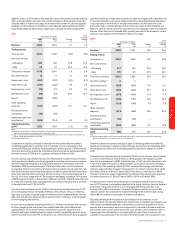
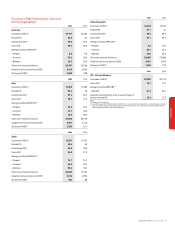
Mobile telecommunications Years ended 31 March
2006 2005 Change
£m £m %
Total service revenue 25,881 23,547 9.9
Other revenue(1) 2,256 2,193 2.9
28,137 25,740 9.3
Trading results
Voice services 21,493 19,888 8.1
Non-voice services
– Messaging 3,556 3,143 13.1
– Data 832 516 61.2
Total service revenue 25,881 23,547 9.9
Net other revenue(1) 532 546 (2.6)
Interconnect costs (4,210) (3,815) 10.4
Other direct costs (1,936) (1,756) 10.3
Net acquisition costs(1) (1,541) (1,446) 6.6
Net retention costs(1) (1,444) (1,234) 17.0
Payroll (2,127) (2,009) 5.9
Other operating expenses (3,625) (3,264) 11.1
Acquired intangibles amortisation (157) –
Purchased licence amortisation (947) (919) 3.0
Depreciation and other amortisation (3,581) (3,341) 7.2
Share of operating profit in associated
undertakings 2,435 2,025 20.2
Adjusted operating profit(2) 9,280 8,334 11.4
Notes:
(1) Revenue for the mobile telecommunications business includes revenue of £1,724 million (2005: £1,647 million) which
has been deducted from acquisition and retention costs and excluded from other revenue in the trading results.
(2) Before impairment losses and non-recurring amounts related to acquisitions and disposals.
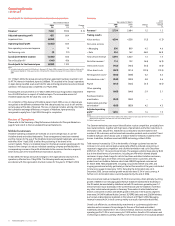
Group Overview Years ended 31 March
2006 2005
£m £m
Revenue
Mobile telecommunications 28,137 25,740
Other operations 1,339 1,095
Less: revenue between mobile and other operations (126) (157)
29,350 26,678
Operating (loss)/profit (14,084) 7,878
Mobile telecommunications(1) 9,280 8,334
Other operations(1) 119 19
Adjusted operating profit(1) 9,399 8,353
– Impairment of intangible assets (23,515) (475)
– Other 15 –
– Non-operating income in associated undertakings 17 –
Non-operating income and expense (2) (7)
Investment income 353 294
Financing costs (1,120) (880)
(Loss)/profit before taxation (14,853) 7,285
Tax on profit (2,380) (1,869)
(Loss)/profit for the financial year from continuing operations (17,233) 5,416
Loss)/profit for the financial year from discontinued operations (4,588) 1,102
(Loss)/profit for the financial year (21,821) 6,518
Note:
(1) Before impairment losses and non-recurring amounts related to business acquisitions and disposals.