Vodafone 2006 Annual Report Download - page 49
Download and view the complete annual report
Please find page 49 of the 2006 Vodafone annual report below. You can navigate through the pages in the report by either clicking on the pages listed below, or by using the keyword search tool below to find specific information within the annual report.-
 1
1 -
2
-
3
-
4
-
5
-
6
-
7
-
8
-
9
-
10
-
11
-
12
-
13
-
14
-
15
-
16
-
17
-
18
-
19
-
20
-
21
-
22
-
23
-
24
-
25
-
26
-
27
-
28
-
29
-
30
-
31
-
32
-
33
-
34
-
35
-
36
-
37
-
38
-
 39
39 -
 40
40 -
 41
41 -
 42
42 -
 43
43 -
 44
44 -
 45
45 -
 46
46 -
 47
47 -
 48
48 -
 49
49 -
 50
50 -
 51
51 -
 52
52 -
 53
53 -
 54
54 -
 55
55 -
 56
56 -
 57
57 -
 58
58 -
 59
59 -
60
-
61
-
62
-
63
-
64
-
65
-
66
-
67
-
68
-
69
-
70
-
71
-
72
-
73
-
74
-
75
-
76
-
77
-
78
-
79
-
80
-
81
-
82
-
83
-
84
-
85
-
86
-
87
-
88
-
89
-
90
-
91
-
92
-
93
-
94
-
95
-
96
-
97
-
98
-
99
-
100
-
101
-
102
-
103
-
104
-
105
-
106
-
107
-
108
-
109
-
110
-
111
-
112
-
113
-
114
-
115
-
116
-
117
-
118
-
119
-
120
-
121
-
122
-
123
-
124
-
125
-
126
-
127
-
128
-
129
-
130
-
131
-
132
-
133
-
134
-
135
-
136
-
137
-
138
-
139
-
140
-
141
-
142
-
143
-
144
-
145
-
146
-
147
-
148
-
149
-
150
-
151
-
152
 |
 |

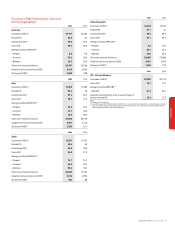
Vodafone Group Plc Annual Report 2006 47
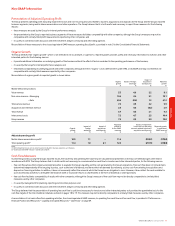
Non-GAAP Information
Presentation of Adjusted Operating Profit
The Group presents operating profit excluding impairment losses and non-recurring amounts related to business acquisitions and disposals for the Group and the Group’s reported
business segments, being mobile telecommunications and other operations. The Group believes that it is both useful and necessary to report these measures for the following
reasons:
•these measures are used by the Group for internal performance analysis;
•the presentation by the Group’s reported business segments of these measures facilitates comparability with other companies, although the Group’s measures may not be
comparable with similarly titled profit measurements reported by other companies; and
•it is useful in connection with discussion with the investment analyst community and debt rating agencies.
Reconciliation of these measures to the closest equivalent GAAP measure, operating (loss)/profit, is provided in note 3 to the Consolidated Financial Statements.
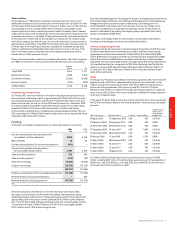
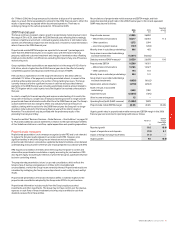
Organic Growth
The Group believes that “organic growth”, which is not intended to be a substitute, or superior to, reported growth, provides useful and necessary information to investors and other
interested parties for the following reasons:
•it provides additional information on underlying growth of the business without the effect of factors unrelated to the operating performance of the business;
•it is used by the Group for internal performance analysis; and
•it facilitates comparability of underlying growth with other companies, although the term “organic” is not a defined term under IFRS, or US GAAP, and may not, therefore, be
comparable with similarly titled measures reported by other companies.
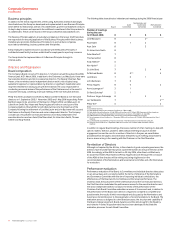
Reconciliation of organic growth to reported growth is shown below:
Impact of
Organic Impact of foreign acquisitions Reported
growth exchange and disposals growth
%%%%
Mobile telecommunications
Voice revenue 5.3 0.6 2.2 8.1
Non-voice revenue – Messaging 10.6 0.4 2.1 13.1
– Data 60.4 (0.4) 1.2 61.2
Total service revenue 7.2 0.5 2.2 9.9
Acquisition and retention revenue 2.3 0.8 (0.2) 2.9
Total revenue 6.7 0.5 2.1 9.3
Interconnect costs 7.2 0.7 2.5 10.4
Group revenue 7.5 0.5 2.0 10.0
Reported Impact of impairment
Impact of Impact of growth in losses and non-recurring Reported growth
Organic foreign acqusitions in non-GAAP amounts related to business in equivalent
growth exchange and disposals measure acquisition and disposals GAAP measure(2)
%%%% %%
Adjusted operating profit
Mobile telecommunications profit(1) 10.3 1.1 – 11.4 (290.2) (278.8)
Total operating profit(1) 11.4 1.0 0.1 12.5 (291.3) (278.8)
Notes:
(1) Before impairment losses and non-recurring amounts related to business acquisitions and disposals.
(2) Closest equivalent GAAP measure is operating (loss)/profit.
Cash Flow Measures
In presenting and discussing the Group’s reported results, free cash flow and operating free cash flow are calculated and presented on the basis of methodologies other than in
accordance with IFRS. The Group believes that it is both useful and necessary to communicate free cash flow to investors and other interested parties, for the following reasons:
•free cash flow allows the Company and external parties to evaluate the Group’s liquidity and the cash generated by the Group’s operations. Free cash flow does not include items
determined independently of the ongoing business, such as the level of dividends, and items which are deemed discretionary, such as cash flows relating to acquisitions and
disposals or financing activities. In addition, it does not necessarily reflect the amounts which the Group has an obligation to incur. However, it does reflect the cash available for
such discretionary activities, to strengthen the balance sheet or to provide returns to shareholders in the form of dividends or share purchases;
•free cash flow facilitates comparability of results with other companies, although the Group’s measure of free cash flow may not be directly comparable to similarly titled
measures used by other companies;
•it is used by management for planning, reporting and incentive purposes; and
•it is useful in connection with discussion with the investment analyst community and debt rating agencies.
The Group believes that the presentation of operating free cash flow is useful and necessary for investors and other interested parties as it provides the quantitative basis for the
cash flow targets of the One Vodafone initiatives outlined on pages 18 to 19. This measure may not be directly comparable to similarly titled measures used by other companies.
A reconciliation of net cash inflow from operating activities, the closest equivalent GAAP measure, to operating free cash flow and free cash flow, is provided in “Performance –
Financial Position and Resources – Liquidity and Capital Resources – Cash Flows” on page 39.
Performance