Reebok 2006 Annual Report Download - page 96
Download and view the complete annual report
Please find page 96 of the 2006 Reebok annual report below. You can navigate through the pages in the report by either clicking on the pages listed below, or by using the keyword search tool below to find specific information within the annual report.-
 1
1 -
2
-
3
-
4
-
5
-
6
-
7
-
8
-
9
-
10
-
11
-
12
-
13
-
14
-
15
-
16
-
17
-
18
-
19
-
20
-
21
-
22
-
23
-
24
-
25
-
26
-
27
-
28
-
29
-
30
-
31
-
32
-
33
-
34
-
35
-
36
-
37
-
38
-
39
-
40
-
41
-
42
-
43
-
44
-
45
-
46
-
47
-
48
-
49
-
50
-
51
-
52
-
53
-
54
-
55
-
56
-
57
-
58
-
59
-
60
-
61
-
62
-
63
-
64
-
65
-
66
-
67
-
68
-
69
-
70
-
71
-
72
-
73
-
74
-
75
-
76
-
77
-
78
-
79
-
80
-
81
-
82
-
83
-
84
-
85
-
 86
86 -
 87
87 -
 88
88 -
 89
89 -
 90
90 -
 91
91 -
 92
92 -
 93
93 -
 94
94 -
 95
95 -
 96
96 -
 97
97 -
 98
98 -
 99
99 -
 100
100 -
 101
101 -
 102
102 -
 103
103 -
 104
104 -
 105
105 -
 106
106 -
107
-
108
-
109
-
110
-
111
-
112
-
113
-
114
-
115
-
116
-
117
-
118
-
119
-
120
-
121
-
122
-
123
-
124
-
125
-
126
-
127
-
128
-
129
-
130
-
131
-
132
-
133
-
134
-
135
-
136
-
137
-
138
-
139
-
140
-
141
-
142
-
143
-
144
-
145
-
146
-
147
-
148
-
149
-
150
-
151
-
152
-
153
-
154
-
155
-
156
-
157
-
158
-
159
-
160
-
161
-
162
-
163
-
164
-
165
-
166
-
167
-
168
-
169
-
170
-
171
-
172
-
173
-
174
-
175
-
176
-
177
-
178
-
179
-
180
-
181
-
182
-
183
-
184
-
185
-
186
-
187
-
188
-
189
-
190
-
191
-
192
-
193
-
194
-
195
-
196
-
197
-
198
-
199
-
200
-
201
-
202
-
203
-
204
-
205
-
206
 |
 |
› Group Business PerformanceGroup Management Report ›
092 ANNUAL REPORT 2006 › adidas Group ›
Limited Comparability due to Accounting Effects
In addition to distorting effects from the factors outlined
above, the comparability of 2006 results with the prior year is
not meaningful as the applicable accounting standards have
changed from US-GAAP to IFRS. Further, significant negative
impacts related to purchase price allocation are included in
the reported results: IFRS regulations stipulate that acquir-
ing companies must allocate the purchase price paid for an
acquisition according to the fair values assigned to acquired
assets and liabilities, the so-called purchase price allocation
(PPA). Following the Reebok acquisition, the adidas Group
hence assigned fair values to assets and liabilities of the
Reebok segment such as trademarks, inventories, backlogs,
contracts and patents. The total fair value of around € 1.8 bil-
lion represents an increase of around € 1.1 billion from the
carrying net amount of € 0.7 billion. As a result, Reebok’s gross
and operating margins were negatively affected by € 76 mil-
lion and € 89 million respectively in 2006. However, these
charges had no cash effect or impact on our operating busi-
ness and free cash flow generation. Comparable prior year
figures based on US-GAAP can only be shown on a sales level
in this section.
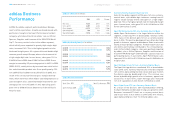
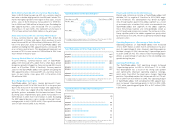
Segment Sales Decline 6% on a Like-for-Like Basis
In the period from February to December 2006, sales for the
Reebok segment decreased 9% on a currency-neutral basis
as a result of declines in North America, Europe and Latin
America that could not be offset by a double-digit revenue
increase in Asia. In euro terms, sales also decreased 9% to
€ 2.473 billion in 2006 from € 2.718 billion in 2005. This rev-
enue decline was expected, following lower sales to certain
key accounts. In addition, the transfer of the NBA and Liver-
pool licensed businesses to brand adidas negatively affected
sales, accounting for approximately 3 percentage points of
Reebok’s sales decline. As a result, currency-neutral sales
for this segment decreased 6% on a like-for-like basis, in line
with our initial guidance of a mid-single-digit decline.
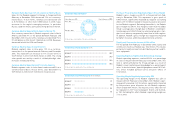
1) Only includes eleven months of the twelve-month period.
Reebok Net Sales by Division1)
Reebok-CCM Hockey 8% Reebok 80%
Rockport 12%
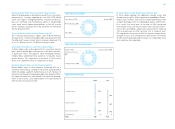
Currency-Neutral Sales of Brand Reebok Down 12%
Brand Reebok sales, which account for 80% of revenues
within the Reebok segment, decreased 12% on a currency-
neutral basis due to declines in lifestyle but also several
major performance categories, which were only partly offset
by increases in running. The transfer of the NBA and Liverpool
licensed businesses to brand adidas also negatively impacted
sales. In euro terms, sales decreased 13% to € 1.979 billion
(2005: € 2.264 billion).
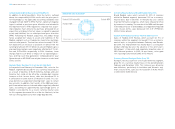
Reebok-CCM Hockey Currency-Neutral Sales Up 11%
Sales of Reebok-CCM Hockey, which account for 8% of
revenues within the segment, increased 11% on a currency-
neutral basis in the period between February and Decem-
ber 2006. The improvement was mainly due to a strong new
product offering, but also the absence of the prior year’s
NHL players’ strike which had negatively impacted sales of
NHL licensed products in 2005. In euro terms, sales grew
16% reaching € 202 million (2005: € 175 million).
Currency-Neutral Rockport Sales Grow 5%
Rockport, which accounts for 12% of sales within the segment,
grew 5% on a currency-neutral basis in the period between
February and December 2006. This increase was driven by
new initiatives, particularly in the Urban and Women’s seg-
ment. In euro terms, sales also increased 5% to € 293 million
in 2006 (2005: € 280 million).