Reebok 2006 Annual Report Download - page 53
Download and view the complete annual report
Please find page 53 of the 2006 Reebok annual report below. You can navigate through the pages in the report by either clicking on the pages listed below, or by using the keyword search tool below to find specific information within the annual report.-
 1
1 -
2
-
3
-
4
-
5
-
6
-
7
-
8
-
9
-
10
-
11
-
12
-
13
-
14
-
15
-
16
-
17
-
18
-
19
-
20
-
21
-
22
-
23
-
24
-
25
-
26
-
27
-
28
-
29
-
30
-
31
-
32
-
33
-
34
-
35
-
36
-
37
-
38
-
39
-
40
-
41
-
42
-
 43
43 -
 44
44 -
 45
45 -
 46
46 -
 47
47 -
 48
48 -
 49
49 -
 50
50 -
 51
51 -
 52
52 -
 53
53 -
 54
54 -
 55
55 -
 56
56 -
 57
57 -
 58
58 -
 59
59 -
 60
60 -
 61
61 -
 62
62 -
 63
63 -
64
-
65
-
66
-
67
-
68
-
69
-
70
-
71
-
72
-
73
-
74
-
75
-
76
-
77
-
78
-
79
-
80
-
81
-
82
-
83
-
84
-
85
-
86
-
87
-
88
-
89
-
90
-
91
-
92
-
93
-
94
-
95
-
96
-
97
-
98
-
99
-
100
-
101
-
102
-
103
-
104
-
105
-
106
-
107
-
108
-
109
-
110
-
111
-
112
-
113
-
114
-
115
-
116
-
117
-
118
-
119
-
120
-
121
-
122
-
123
-
124
-
125
-
126
-
127
-
128
-
129
-
130
-
131
-
132
-
133
-
134
-
135
-
136
-
137
-
138
-
139
-
140
-
141
-
142
-
143
-
144
-
145
-
146
-
147
-
148
-
149
-
150
-
151
-
152
-
153
-
154
-
155
-
156
-
157
-
158
-
159
-
160
-
161
-
162
-
163
-
164
-
165
-
166
-
167
-
168
-
169
-
170
-
171
-
172
-
173
-
174
-
175
-
176
-
177
-
178
-
179
-
180
-
181
-
182
-
183
-
184
-
185
-
186
-
187
-
188
-
189
-
190
-
191
-
192
-
193
-
194
-
195
-
196
-
197
-
198
-
199
-
200
-
201
-
202
-
203
-
204
-
205
-
206
 |
 |

049
Operating Margin as Key Performance Indicator of
Operational Progress
Operating margin (defined as operating profit as a percent-
age of net sales) is our Group’s most important measure of
operational success as it combines the quality of our top-line
development with our ability to drive efficiencies through our
business. The primary drivers enhancing the Group’s oper-
ating margin are continued gross margin improvements and
operating expense control. Operating expense control is par-
ticularly important as we strive to leverage the Group’s growth
through to the bottom line. To control operating expenses,
Management has set clear guidelines for both variable and
fixed cost pillars. We plan our marketing working budget as a
percentage of targeted sales each year and constantly monitor
deviations. Over the last few years, our efforts have focused
on optimizing the split between communication (includ-
ing advertising, retail presentation and public relations) and
promotional expenditure. By concentrating on well-selected
premium partnerships with top events, associations, leagues,
clubs and athletes, we have been able to reduce the Group’s
relative promotion spend. As a result, we are improving the
balance between promotional and brand communication
within the marketing working budget. We also aim to reduce
operating overhead expenses as a percentage of sales by
continuously improving internal processes through efficiency
programs in our sales, distribution, finance, IT and other gen-
eral administration functions.
Tight Operating Working Capital Management
Due to a comparatively low level of fixed assets required in
our business, operating working capital management is a
major focus of our efforts to improve the efficiency of the
Group’s balance sheet. We have made major strides in this
area through tight working capital management focused on
continuously improving our Group’s inventories, accounts
receivable and accounts payable. Our key metric is operating
working capital as a percentage of net sales. Monitoring the
development of this key metric facilitates the measurement
of our progress in improving the efficiency of our business
cycle. Inventory levels and ageing are controlled to ensure
fast replenishment and to keep our product offering current.
Accounts receivable are managed by continuously improving
collection efforts to reduce Days of Sales Outstanding (DSO).
Likewise, we strive to optimize payment terms with our sup-
pliers to best manage our accounts payable.
Capital Expenditure Targeted to Maximize Future Returns
Improving the effectiveness of the Group’s capital expenditure
is another lever to maximize the Group’s free cash flow. Plan-
ning and control are of particular importance as we strive to
select capital projects that enable our Group to meet targeted
commercial and operational goals. We limit capital expendi-
ture levels through disciplined budget monitoring and focused
expenditure on our core strategies. Our capital expenditure is
controlled with a top-down, bottom-up approach. We evalu-
ate potential return on planned investments utilizing the net
present value or internal rate of return method, in relation to
the cost of capital. Specific investments are assessed accord-
ing to the principles of risk-weighted returns.
adidas Group ›» Internal Group Management System
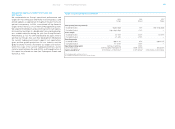
1) Excluding goodwill and finance leases.
Key Financial Metrics
Gross margin = Gross profit
Net sales × 100
Operating margin = Operating profit
Net sales × 100
Average operating
working capital =
Sum of operating
working capital
at quarter-end
4
Operating working capital
in % of net sales =
Average operating
working capital
Net sales × 100
Capital expenditure1) =
Additions of property,
plant and equipment plus
intangible assets