Reebok 2006 Annual Report Download - page 81
Download and view the complete annual report
Please find page 81 of the 2006 Reebok annual report below. You can navigate through the pages in the report by either clicking on the pages listed below, or by using the keyword search tool below to find specific information within the annual report.-
 1
1 -
2
-
3
-
4
-
5
-
6
-
7
-
8
-
9
-
10
-
11
-
12
-
13
-
14
-
15
-
16
-
17
-
18
-
19
-
20
-
21
-
22
-
23
-
24
-
25
-
26
-
27
-
28
-
29
-
30
-
31
-
32
-
33
-
34
-
35
-
36
-
37
-
38
-
39
-
40
-
41
-
42
-
43
-
44
-
45
-
46
-
47
-
48
-
49
-
50
-
51
-
52
-
53
-
54
-
55
-
56
-
57
-
58
-
59
-
60
-
61
-
62
-
63
-
64
-
65
-
66
-
67
-
68
-
69
-
70
-
 71
71 -
 72
72 -
 73
73 -
 74
74 -
 75
75 -
 76
76 -
 77
77 -
 78
78 -
 79
79 -
 80
80 -
 81
81 -
 82
82 -
 83
83 -
 84
84 -
 85
85 -
 86
86 -
 87
87 -
 88
88 -
 89
89 -
 90
90 -
 91
91 -
92
-
93
-
94
-
95
-
96
-
97
-
98
-
99
-
100
-
101
-
102
-
103
-
104
-
105
-
106
-
107
-
108
-
109
-
110
-
111
-
112
-
113
-
114
-
115
-
116
-
117
-
118
-
119
-
120
-
121
-
122
-
123
-
124
-
125
-
126
-
127
-
128
-
129
-
130
-
131
-
132
-
133
-
134
-
135
-
136
-
137
-
138
-
139
-
140
-
141
-
142
-
143
-
144
-
145
-
146
-
147
-
148
-
149
-
150
-
151
-
152
-
153
-
154
-
155
-
156
-
157
-
158
-
159
-
160
-
161
-
162
-
163
-
164
-
165
-
166
-
167
-
168
-
169
-
170
-
171
-
172
-
173
-
174
-
175
-
176
-
177
-
178
-
179
-
180
-
181
-
182
-
183
-
184
-
185
-
186
-
187
-
188
-
189
-
190
-
191
-
192
-
193
-
194
-
195
-
196
-
197
-
198
-
199
-
200
-
201
-
202
-
203
-
204
-
205
-
206
 |
 |

lllllllllllllllllllllllllllllllllllllllllllllllllllllll
llllllllllllllllllllllllllllllllllllllllllllllllllllll
llllllllllllllllllllllllllllllllllllllllllllllllllllll
llllllllllllllllllllllllllllllllllllllllllllllllllllllllllllll
lllllllllllllllllllllllllllllllllllllllllllllllllllllllllllllllllllllllllllllllllllllll
lllllllllllllllllllllllllllllllllllllllllllllllllllllllllllllllllllllllllllllll
llllllllllllllllllllllllllllllllllllllllllllllllllllllllllllllllllllllllllllllllll
llllllllllllllllllllllllllllllllllllllllllllllllllllllllllllllllllllllllllllllllllllllll
lllllllllllllllllllllllllllllllllllllllllllllllllllllllllllllllllllllllllllllllllllllllll
lllllllllllllllllllllllllllllllllllllllllllllllllllllllllllllllllllllllllllllllll
llllllllllllllllllllllllllllllllllllllllllllllllll
lllllllllllllllllllllllllllllllllllllllllllllllllllllllllllllllllllll
lllllllllllllllllllllllllllllllllllllllllllllll
llllllllllllllllllllllllllllllllllllllllllllllllllllllllllllll
llllllllllllllllllllllllllllllllllllllllllllllllllllllllll
lllllllllllllllllllllllllllllllllllllllllllllllllllllllllllllllllllllllllllllllllll
lllllllllllllllllllllllllllllllllllllllllllll
lllllllllllllllllllllllllllllllllllllllllllllllllllllllllllll
adidas Group ›077
Cost of Sales Growth Largely in Line with Revenue Increase
Our Group defines cost of sales as the amount we pay to third
parties for expenses associated with producing and deliver-
ing our products. Similarly, although only representing a very
small portion of total cost of sales, own-production expenses
at adidas and Reebok as well as assembling expenses at
TaylorMade-adidas Golf are also included in the Group’s cost
of sales. In 2006, cost of sales was € 5.589 billion, repre-
senting an increase of 63% from € 3.439 billion in 2005. This
reflects higher sourcing costs necessitated by the first-time
consolidation of the Reebok business. For the adidas Group
excluding Reebok, cost of sales grew 15% to € 3.943 billion
in 2006 from € 3.439 billion in 2005, broadly in line with the
strong organic sales growth during the period. Increasing
labor and raw material costs were largely compensated by
efficiency gains within our supply chain as well as positive
impacts from an improved business and product mix.
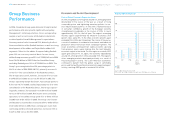
Group Gross Profit Increases 41%
The Group’s gross margin declined 3.6 percentage points to
44.6% of sales in 2006 (2005: 48.2%), mainly reflecting the
first-time consolidation of Reebok, which more than off-
set a positive gross margin development in the adidas seg-
ment. Due to Reebok’s strong presence in North America,
where average gross margins are lower than in other regions,
Reebok carries a significantly lower gross margin than the
Group average. In addition, Reebok’s gross profit in 2006
includes negative impacts from purchase price allocation in
an amount of € 76 million. As a result of the Group’s strong
top-line growth, gross profit rose by 41% in 2006 to reach
€ 4.495 billion versus € 3.197 billion in the prior year. For
the adidas Group excluding Reebok, gross margin decreased
0.4 percentage points to 47.8% in 2006 (2005: 48.2%), mainly
due to a gross margin decline in the Group’s HQ/Consolida-
tion segment as a result of the Group’s cooperation agree-
ment with Amer Sports Corporation, which more than offset
the gross margin increase at adidas. The gross margin of
TaylorMade-adidas Golf declined marginally as a result of the
inclusion of the Greg Norman apparel business. Gross profit
for the Group excluding Reebok grew by 13% to € 3.605 billion
in 2006 (2005: € 3.197 billion).
Royalty and Commission Income Grows Strongly
Royalty and commission income for the adidas Group increased
94% on a currency-neutral basis, mainly driven by the first-
time consolidation of the Reebok business. In euro terms,
royalty and commission income increased by 91% to € 90 mil-
lion in 2006 from € 47 million in the prior year. Royalty and
commission income for the adidas Group excluding Reebok
increased 19% on a currency-neutral basis due to higher
royalty and commission income at brand adidas. An increased
number of units sold as well as higher average royalty rates
drove this development. In euro terms, royalty and commis-
sion income for the adidas Group excluding Reebok grew 18%
to € 56 million in 2006 from € 47 million in 2005.
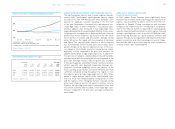
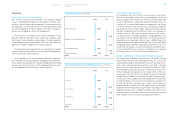
Gross Profit € in millions
2002
2003
20041)
20051)
20062)
2,819
2,814
2,813
3,197
4,495
1) Figures reflect continuing operations as a result of the divestiture of the Salomon
business segment.
2) Including Reebok business segment from February 1, 2006 onwards, excluding
Greg Norman wholesale business from December 1, 2006 onwards.
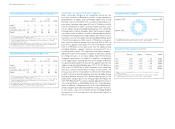
Gross Margin in %
2002
2003
20041)
20051)
20062)
43.2
44.9
48.0
48.2
44.6
1) Figures reflect continuing operations as a result of the divestiture of the Salomon
business segment.
2) Including Reebok business segment from February 1, 2006 onwards, excluding
Greg Norman wholesale business from December 1, 2006 onwards.
Gross Profit by Quarter € in millions
Q1 20051)
Q1 20062)
Q2 20051)
Q2 20063)
Q3 20051)
Q3 20063)
Q4 20051)
Q4 20064)
805
1,107
743
1,084
934
1,327
716
976
1) Figures reflect continuing operations as a result of the divestiture of the Salomon
business segment.
2) Including Reebok business segment from February 1, 2006 onwards.
3) Including Reebok business segment.
4) Including Reebok business segment, excluding Greg Norman wholesale business
from December 1, 2006 onwards.
» Income Statement