Reebok 2006 Annual Report Download - page 2
Download and view the complete annual report
Please find page 2 of the 2006 Reebok annual report below. You can navigate through the pages in the report by either clicking on the pages listed below, or by using the keyword search tool below to find specific information within the annual report.-
 1
1 -
 2
2 -
 3
3 -
 4
4 -
 5
5 -
 6
6 -
 7
7 -
 8
8 -
 9
9 -
 10
10 -
 11
11 -
 12
12 -
 13
13 -
14
-
15
-
16
-
17
-
18
-
19
-
20
-
21
-
22
-
23
-
24
-
25
-
26
-
27
-
28
-
29
-
30
-
31
-
32
-
33
-
34
-
35
-
36
-
37
-
38
-
39
-
40
-
41
-
42
-
43
-
44
-
45
-
46
-
47
-
48
-
49
-
50
-
51
-
52
-
53
-
54
-
55
-
56
-
57
-
58
-
59
-
60
-
61
-
62
-
63
-
64
-
65
-
66
-
67
-
68
-
69
-
70
-
71
-
72
-
73
-
74
-
75
-
76
-
77
-
78
-
79
-
80
-
81
-
82
-
83
-
84
-
85
-
86
-
87
-
88
-
89
-
90
-
91
-
92
-
93
-
94
-
95
-
96
-
97
-
98
-
99
-
100
-
101
-
102
-
103
-
104
-
105
-
106
-
107
-
108
-
109
-
110
-
111
-
112
-
113
-
114
-
115
-
116
-
117
-
118
-
119
-
120
-
121
-
122
-
123
-
124
-
125
-
126
-
127
-
128
-
129
-
130
-
131
-
132
-
133
-
134
-
135
-
136
-
137
-
138
-
139
-
140
-
141
-
142
-
143
-
144
-
145
-
146
-
147
-
148
-
149
-
150
-
151
-
152
-
153
-
154
-
155
-
156
-
157
-
158
-
159
-
160
-
161
-
162
-
163
-
164
-
165
-
166
-
167
-
168
-
169
-
170
-
171
-
172
-
173
-
174
-
175
-
176
-
177
-
178
-
179
-
180
-
181
-
182
-
183
-
184
-
185
-
186
-
187
-
188
-
189
-
190
-
191
-
192
-
193
-
194
-
195
-
196
-
197
-
198
-
199
-
200
-
201
-
202
-
203
-
204
-
205
-
206
 |
 |
lllllllllllllllllllllllllllllllllllllllllllllllllllllllll
llllllllllllllllllllllllllllllllllllllllllllllllllllll
lllllllllllllllllllllllllllllllllllllllllllllllllll
llllllllllllllllllllllllllllllllllllllllllllllllllllllllll
lllllllllllllllllllllllllllllllllllllllllllllllllllllllllllllllllllllllllllllllllllllll
lllllllllllllllllllllllllllllllllllllllllll
lllllllllllllllllllllllllllllllllllllllllllllllll
llllllllllllllllllllllllllllllllllllllllllllllllllllllllll
llllllllllllllllllllllllllllllllllllllllllllllllllllllllllllllllllllll
llllllllllllllllllllllllllllllllllllllllllllllllllllllllllllllllllllllllllllllllllllllllll
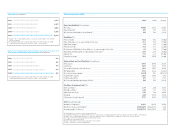
20061) 20052) Change
Operating Highlights (€ in millions)
Net sales 10,084 6,636 52.0%
Operating profit 881 707 24.5%
Net income attributable to shareholders3) 483 383 26.1%
Key Ratios (%)
Gross margin 44.6 48.2 (3.6pp)
Operating expenses as a percentage of net sales 36.7 38.2 (1.5pp)
Operating margin 8.7 10.7 (1.9pp)
Effective tax rate 31.4 33.7 (2.3pp)
Net income attributable to shareholders3) as a percentage of net sales 4.8 5.8 (1.0pp)
Operating working capital as a percentage of net sales4) 25.8 26.0 (0.2pp)
Equity ratio 33.8 46.7 (12.9pp)
Financial leverage 78.9 (20.5) 99.4pp
Balance Sheet and Cash Flow Data (€ in millions)
Total assets 8,379 5,750 45.7%
Inventories 1,607 1,230 30.7%
Receivables and other current assets 1,913 1,551 25.2%
Working capital 1,733 2,644 (34.4%)
Net cash (net borrowings) (2,231) 551 (505.1%)
Shareholders’ equity 2,828 2,684 5.4%
Capital expenditure 277 211 31.3%
Net cash provided by operating activities4) 762 352 116.3%
Per Share of Common Stock5) (€)
Basic earnings3) 2.37 2.05 15.9%
Diluted earnings3) 2.25 1.93 16.6%
Operating cash flow4) 3.74 1.88 98.8%
Dividend 0.426) 0.325 29.2%
Share price at end of period 37.73 40.00 (5.7%)
Other (at end of period)
Number of employees 26,376 15,935 65.5%
Number of shares outstanding5) 203,536,860 203,047,020 0.2%
Average number of shares5) 203,386,104 186,947,832 8.8%
Rounding differences may arise in percentages and totals.
1) Including Reebok business segment from February 1, 2006 onwards, excluding Greg Norman wholesale business from December 1, 2006 onwards.
2) Figures reflect continuing operations as a result of the divestiture of the Salomon business segment in 2005 unless otherwise stated.
3) Includes income from continuing and discountinued operations.
4) Includes discontinued operations.
5) Figures adjusted for 1: 4 share split conducted on June 6, 2006.
6) Subject to Annual General Meeting approval.
Financial Highlights (IFRS)Net Sales € in millions
2002
2003
20041)
20051)
20062)
6,523
6,267
5,860
6,636
10,084
1) Figures reflect continuing operations as a result of the divestiture of the Salomon
business segment.
2) Including Reebok business segment from February 1, 2006 onwards, excluding
Greg Norman wholesale business from December 1, 2006 onwards.
Net Income Attributable to Shareholders € in millions
2002
2003
2004
2005
20061)
229
260
314
383
483
1) Including Reebok business segment from February 1, 2006 onwards, excluding
Greg Norman wholesale business from December 1, 2006 onwards.