Reebok 2006 Annual Report Download - page 194
Download and view the complete annual report
Please find page 194 of the 2006 Reebok annual report below. You can navigate through the pages in the report by either clicking on the pages listed below, or by using the keyword search tool below to find specific information within the annual report.-
 1
1 -
2
-
3
-
4
-
5
-
6
-
7
-
8
-
9
-
10
-
11
-
12
-
13
-
14
-
15
-
16
-
17
-
18
-
19
-
20
-
21
-
22
-
23
-
24
-
25
-
26
-
27
-
28
-
29
-
30
-
31
-
32
-
33
-
34
-
35
-
36
-
37
-
38
-
39
-
40
-
41
-
42
-
43
-
44
-
45
-
46
-
47
-
48
-
49
-
50
-
51
-
52
-
53
-
54
-
55
-
56
-
57
-
58
-
59
-
60
-
61
-
62
-
63
-
64
-
65
-
66
-
67
-
68
-
69
-
70
-
71
-
72
-
73
-
74
-
75
-
76
-
77
-
78
-
79
-
80
-
81
-
82
-
83
-
84
-
85
-
86
-
87
-
88
-
89
-
90
-
91
-
92
-
93
-
94
-
95
-
96
-
97
-
98
-
99
-
100
-
101
-
102
-
103
-
104
-
105
-
106
-
107
-
108
-
109
-
110
-
111
-
112
-
113
-
114
-
115
-
116
-
117
-
118
-
119
-
120
-
121
-
122
-
123
-
124
-
125
-
126
-
127
-
128
-
129
-
130
-
131
-
132
-
133
-
134
-
135
-
136
-
137
-
138
-
139
-
140
-
141
-
142
-
143
-
144
-
145
-
146
-
147
-
148
-
149
-
150
-
151
-
152
-
153
-
154
-
155
-
156
-
157
-
158
-
159
-
160
-
161
-
162
-
163
-
164
-
165
-
166
-
167
-
168
-
169
-
170
-
171
-
172
-
173
-
174
-
175
-
176
-
177
-
178
-
179
-
180
-
181
-
182
-
183
-
 184
184 -
 185
185 -
 186
186 -
 187
187 -
 188
188 -
 189
189 -
 190
190 -
 191
191 -
 192
192 -
 193
193 -
 194
194 -
 195
195 -
 196
196 -
 197
197 -
 198
198 -
 199
199 -
 200
200 -
 201
201 -
 202
202 -
 203
203 -
 204
204 -
205
-
206
 |
 |
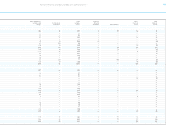
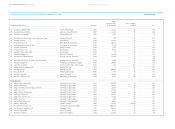
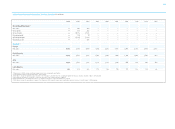
190 ANNUAL REPORT 2006 › adidas Group ›
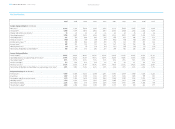
adidas Group Segmental Information: Ten-Year Overview € in millions
2006 2005 2004 2003 2002 2001 2000 1999 1998 1997
BRANDS
adidas
Net sales 6,626 5,861 5,174 4,950 5,105 4,825 4,672 4,427 4,316 3,425
Gross profit 3,059 2,654 2,284 2,008 2,004 1,845 1,907 1,827 1,818 1,437
Gross margin 46.2% 45.3% 44.1% 40.6% 39.2% 38.2% 40.8% 41.1% 42.1% 41.9%
Operating profit 1) 788 693 564 365 343 352 391 431 412 316
Operating margin 1) 11.9% 11.8% 10.9% 7.4% 6.7% 7.3% 8.3% 9.6% 9.5% 9.2%
Operating assets 3,211 2,536 2,089 2,172 2,294 1,954 2,286 1,987 1,730 1,498
Reebok 2)
Net sales 2,473 — — — — — — — — —
Gross profit 865 — — — — — — — — —
Gross margin 35.0% — — — — — — — — —
Operating profit 86 — — — — — — — — —
Operating margin 3.5% — — — — — — — — —
Operating assets 3,217 — — — — — — — — —
TaylorMade-adidas Golf 3)
Net sales 856 709 633 637 707 545 441 327 263 —
Gross profit 376 312 298 290 345 281 221 160 118 —
Gross margin 43.9% 44.0% 47.0% 45.5% 48.8% 51.5% 49.5% 48.4% 44.9% —
Operating profit 1) 73 50 48 67 74 63 44 30 20 —
Operating margin 1) 8.5% 7.1% 7.5% 10.6% 10.5% 11.5% 10.0% 9.2% 7.6% —
Operating assets 656 692 619 391 433 316 219 156 99 —
Salomon 4)
Net sales — — — 658 684 714 703 587 487 —
Gross profit — — — 264 279 313 296 233 188 —
Gross margin — — — 40.1% 40.8% 43.8% 42.1% 39.7% 38.6% —
Operating profit — — — 35 39 63 61 32 6 —
Operating margin — — — 5.4% 5.7% 8.8% 8.7% 5.5% 1.2% —
Operating assets — — — 521 581 679 566 533 598 —
Segmental Information ›