Reebok 2006 Annual Report Download - page 196
Download and view the complete annual report
Please find page 196 of the 2006 Reebok annual report below. You can navigate through the pages in the report by either clicking on the pages listed below, or by using the keyword search tool below to find specific information within the annual report.-
 1
1 -
2
-
3
-
4
-
5
-
6
-
7
-
8
-
9
-
10
-
11
-
12
-
13
-
14
-
15
-
16
-
17
-
18
-
19
-
20
-
21
-
22
-
23
-
24
-
25
-
26
-
27
-
28
-
29
-
30
-
31
-
32
-
33
-
34
-
35
-
36
-
37
-
38
-
39
-
40
-
41
-
42
-
43
-
44
-
45
-
46
-
47
-
48
-
49
-
50
-
51
-
52
-
53
-
54
-
55
-
56
-
57
-
58
-
59
-
60
-
61
-
62
-
63
-
64
-
65
-
66
-
67
-
68
-
69
-
70
-
71
-
72
-
73
-
74
-
75
-
76
-
77
-
78
-
79
-
80
-
81
-
82
-
83
-
84
-
85
-
86
-
87
-
88
-
89
-
90
-
91
-
92
-
93
-
94
-
95
-
96
-
97
-
98
-
99
-
100
-
101
-
102
-
103
-
104
-
105
-
106
-
107
-
108
-
109
-
110
-
111
-
112
-
113
-
114
-
115
-
116
-
117
-
118
-
119
-
120
-
121
-
122
-
123
-
124
-
125
-
126
-
127
-
128
-
129
-
130
-
131
-
132
-
133
-
134
-
135
-
136
-
137
-
138
-
139
-
140
-
141
-
142
-
143
-
144
-
145
-
146
-
147
-
148
-
149
-
150
-
151
-
152
-
153
-
154
-
155
-
156
-
157
-
158
-
159
-
160
-
161
-
162
-
163
-
164
-
165
-
166
-
167
-
168
-
169
-
170
-
171
-
172
-
173
-
174
-
175
-
176
-
177
-
178
-
179
-
180
-
181
-
182
-
183
-
184
-
185
-
 186
186 -
 187
187 -
 188
188 -
 189
189 -
 190
190 -
 191
191 -
 192
192 -
 193
193 -
 194
194 -
 195
195 -
 196
196 -
 197
197 -
 198
198 -
 199
199 -
 200
200 -
 201
201 -
 202
202 -
 203
203 -
 204
204 -
 205
205 -
 206
206
 |
 |

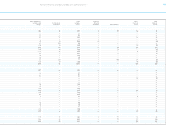
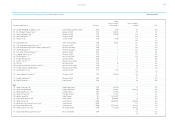
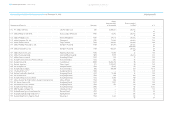
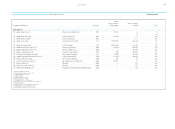
192 ANNUAL REPORT 2006 › adidas Group ›
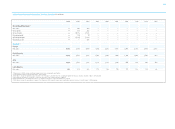
20061) 2005 2004 2003 2002 2001 2000 1999 19982) 1997
Income Statement Data (€ in millions)
Net sales 3) 10,084 6,636 5,860 6,267 6,523 6,112 5,835 5,354 5,065 3,425
Gross profit 3) 4,495 3,197 2,813 2,814 2,819 2,601 2,528 2,352 2,124 1,437
Royalty and commission income 3) 90 47 42 42 46 42 43 35 45 44
Operating expenses 3) 3,704 2,537 2,236 2,324 2,343 2,126 2,091 1,870 1,698 1,129
Operating profit 3) 4) 881 707 584 490 477 475 437 482 416 316
Financial result 3) 5) (158) (52) (59) (49) (87) (102) (94) (84) (115) (16)
Income before taxes 3) 5) 723 655 526 438 390 376 347 398 319 346
Income taxes 3) 227 221 193 167 148 147 140 153 105 95
Minority interests 3) 5) (13) (8) (7) (11) (14) (21) (25) (18) (9) (14)
Net income attributable to shareholders 6) 483 383 314 260 229 208 182 228 205 237
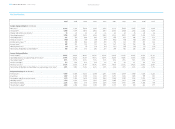
Income Statement Ratios
Gross margin 3) 44.6% 48.2% 48.0% 44.9% 43.2% 42.6% 43.3% 43.9% 41.9% 41.9%
Operating expenses as a percentage of net sales 3) 36.7% 38.2% 38.2% 37.1% 35.9% 34.8% 35.8% 34.9% 33.5% 33.0%
Operating margin 3) 4) 8.7% 10.7% 10.0% 7.8% 7.3% 7.8% 7.5% 9.0% 8.2% 9.2%
Interest coverage 3) 5.9 18.4 10.2 8.4 6.4 4.9 4.6 6.1 4.8 21.2
Effective tax rate 3) 31.4% 33.7% 36.7% 38.0% 37.9% 39.0% 40.3% 38.4% 33.0% 27.5%
Net income attributable to shareholders as a percentage of net sales 6) 4.8% 5.8% 5.4% 4.2% 3.5% 3.4% 3.1% 4.3% 4.0% 6.9%
Balance Sheet Data (€ in millions)
Total assets 5) 8,379 5,750 4,434 4,188 4,261 4,183 4,018 3,587 3,206 2,224
Inventories 1,607 1,230 1,155 1,164 1,190 1,273 1,294 1,045 975 821
Receivables and other current assets 1,913 1,551 1,425 1,335 1,560 1,520 1,387 1,234 1,026 592
Working capital 5) 1,733 2,644 1,336 1,433 1,445 1,485 1,417 1,096 (327) 11
Net total borrowings 2,231 (551) 665 1,018 1,498 1,679 1,791 1,591 1,655 738
Shareholders’ equity 5) 2,828 2,684 1,544 1,285 1,081 1,015 815 680 463 717
Ten-Year Overview
Ten-Year Overview ›