Reebok 2006 Annual Report Download - page 181
Download and view the complete annual report
Please find page 181 of the 2006 Reebok annual report below. You can navigate through the pages in the report by either clicking on the pages listed below, or by using the keyword search tool below to find specific information within the annual report.-
 1
1 -
2
-
3
-
4
-
5
-
6
-
7
-
8
-
9
-
10
-
11
-
12
-
13
-
14
-
15
-
16
-
17
-
18
-
19
-
20
-
21
-
22
-
23
-
24
-
25
-
26
-
27
-
28
-
29
-
30
-
31
-
32
-
33
-
34
-
35
-
36
-
37
-
38
-
39
-
40
-
41
-
42
-
43
-
44
-
45
-
46
-
47
-
48
-
49
-
50
-
51
-
52
-
53
-
54
-
55
-
56
-
57
-
58
-
59
-
60
-
61
-
62
-
63
-
64
-
65
-
66
-
67
-
68
-
69
-
70
-
71
-
72
-
73
-
74
-
75
-
76
-
77
-
78
-
79
-
80
-
81
-
82
-
83
-
84
-
85
-
86
-
87
-
88
-
89
-
90
-
91
-
92
-
93
-
94
-
95
-
96
-
97
-
98
-
99
-
100
-
101
-
102
-
103
-
104
-
105
-
106
-
107
-
108
-
109
-
110
-
111
-
112
-
113
-
114
-
115
-
116
-
117
-
118
-
119
-
120
-
121
-
122
-
123
-
124
-
125
-
126
-
127
-
128
-
129
-
130
-
131
-
132
-
133
-
134
-
135
-
136
-
137
-
138
-
139
-
140
-
141
-
142
-
143
-
144
-
145
-
146
-
147
-
148
-
149
-
150
-
151
-
152
-
153
-
154
-
155
-
156
-
157
-
158
-
159
-
160
-
161
-
162
-
163
-
164
-
165
-
166
-
167
-
168
-
169
-
170
-
 171
171 -
 172
172 -
 173
173 -
 174
174 -
 175
175 -
 176
176 -
 177
177 -
 178
178 -
 179
179 -
 180
180 -
 181
181 -
 182
182 -
 183
183 -
 184
184 -
 185
185 -
 186
186 -
 187
187 -
 188
188 -
 189
189 -
 190
190 -
 191
191 -
192
-
193
-
194
-
195
-
196
-
197
-
198
-
199
-
200
-
201
-
202
-
203
-
204
-
205
-
206
 |
 |

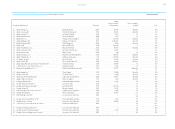
Notes ›177
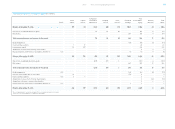
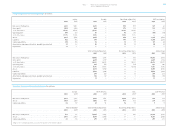
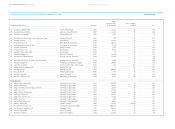
Primary Segmental Information by Brand € in millions
adidas Reebok TaylorMade-adidas Golf HQ/Consolidation
2006 2005 2006 2005 2006 2005 2006 2005
Net sales to third parties 6,626 5,861 2,473 — 856 709 129 66
Gross profit 3,059 2,654 865 — 376 312 196 232
in % of net sales 46.2% 45.3% 35.0% — 43.9% 44.0% — —
Operating profit 788 693 86 — 73 50 (65) (36)
in % of net sales 11.9% 11.8% 3.5% — 8.5% 7.1% — —
Assets 3,211 2,536 3,217 — 656 692 1,295 2,522
Liabilities 752 714 477 — 106 110 4,208 2,214
Capital expenditure 135 138 72 — 13 17 57 45
Amortization and depreciation (excl. goodwill amortization) 91 69 53 — 13 13 25 30
Impairment 11 — — — — — — —
Total Continuing Operations Discontinued Operations adidas Group
2006 2005 2006 2005 2006 2005
Net sales to third parties 10,084 6,636 — 360 10,084 6,996
Gross profit 4,459 3,197 — 137 4,459 3,334
in % of net sales 44.6% 48.2% — 38.1% 44.6% 47.7%
Operating profit 881 707 — (21) 881 686
in % of net sales 8.7% 10.7% — (5.9%) 8.7% 9.8%
Assets 8,379 5,750 — 0 8,379 5,750
Liabilities 5,543 3,038 — 0 5,543 3,038
Capital expenditure 277 200 — 11 277 211
Amortization and depreciation (excl. goodwill amortization) 182 112 — 3 182 115
Impairment 11 — — — 11 —
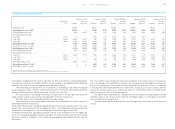
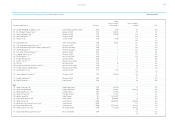
Secondary Segmental Information by Region € in millions
Europe North America Asia Latin America
2006 20051) 2006 20051) 2006 20051) 2006 20051)
Net sales to third parties 4,162 3,166 3,234 1,561 2,020 1,523 499 319
Assets 1,808 1,259 1,564 979 719 617 217 176
Capital expenditure 84 57 49 51 74 37 7 5
HQ/Consolidation Total Continuing Operations Discontinued Operations adidas Group
2006 20051) 2006 2005 2006 2005 2006 2005
Net sales to third parties 169 66 10,084 6,636 — 360 10,084 6,996
Assets 4,071 2,719 8,379 5,750 — — 8,379 5,750
Capital expenditure 63 50 277 200 — 11 277 211
1) Figures reflect continuing operations as a result of the divestiture of the Salomon segment.
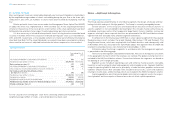
› Notes to the Consolidated Income Statement
› Notes – Additional Information