Reebok 2006 Annual Report Download - page 83
Download and view the complete annual report
Please find page 83 of the 2006 Reebok annual report below. You can navigate through the pages in the report by either clicking on the pages listed below, or by using the keyword search tool below to find specific information within the annual report.-
 1
1 -
2
-
3
-
4
-
5
-
6
-
7
-
8
-
9
-
10
-
11
-
12
-
13
-
14
-
15
-
16
-
17
-
18
-
19
-
20
-
21
-
22
-
23
-
24
-
25
-
26
-
27
-
28
-
29
-
30
-
31
-
32
-
33
-
34
-
35
-
36
-
37
-
38
-
39
-
40
-
41
-
42
-
43
-
44
-
45
-
46
-
47
-
48
-
49
-
50
-
51
-
52
-
53
-
54
-
55
-
56
-
57
-
58
-
59
-
60
-
61
-
62
-
63
-
64
-
65
-
66
-
67
-
68
-
69
-
70
-
71
-
72
-
 73
73 -
 74
74 -
 75
75 -
 76
76 -
 77
77 -
 78
78 -
 79
79 -
 80
80 -
 81
81 -
 82
82 -
 83
83 -
 84
84 -
 85
85 -
 86
86 -
 87
87 -
 88
88 -
 89
89 -
 90
90 -
 91
91 -
 92
92 -
 93
93 -
94
-
95
-
96
-
97
-
98
-
99
-
100
-
101
-
102
-
103
-
104
-
105
-
106
-
107
-
108
-
109
-
110
-
111
-
112
-
113
-
114
-
115
-
116
-
117
-
118
-
119
-
120
-
121
-
122
-
123
-
124
-
125
-
126
-
127
-
128
-
129
-
130
-
131
-
132
-
133
-
134
-
135
-
136
-
137
-
138
-
139
-
140
-
141
-
142
-
143
-
144
-
145
-
146
-
147
-
148
-
149
-
150
-
151
-
152
-
153
-
154
-
155
-
156
-
157
-
158
-
159
-
160
-
161
-
162
-
163
-
164
-
165
-
166
-
167
-
168
-
169
-
170
-
171
-
172
-
173
-
174
-
175
-
176
-
177
-
178
-
179
-
180
-
181
-
182
-
183
-
184
-
185
-
186
-
187
-
188
-
189
-
190
-
191
-
192
-
193
-
194
-
195
-
196
-
197
-
198
-
199
-
200
-
201
-
202
-
203
-
204
-
205
-
206
 |
 |

llllllllllllllllllllllllllllllllllllllllllllllll
lllllllllllllllllllllllllllllllllllllllllllllllll
lllllllllllllllllllllllllllllllllllllllllllllllllllllllllll
lllllllllllllllllllllllllllllllllllllllllllllllllllllllllllllllllllllll
llllllllllllllllllllllllllllllllllllllllllllllllllllllllllllllllllllllllllllllllllllllllll
llllllllllllllllllllllllllllllllllllllllllllllllllllllllllll
llllllllllllllllllllllllllllllllllllllllllllllllllllllllllllllll
llllllllllllllllllllllllllllllllllllllllllllllllllllllllllllllllllllllllllllllllll
lllllllllllllllllllllllllllllllllllllllllllllllllllllllllllllllllllllllllllllllllllllllll
lllllllllllllllllllllllllllllllllllllllllllllllllllllllllllllllllllllll
lllllllllllllllllllllllllllllllllllllllllll
llllllllllllllllllllllllllllllllllllllllllllllllllll
llllllllllllllllllllllllllllllll
llllllllllllllllllllllllllllllllllll
llllllllllllllllllllllllllllllllllllllllllllllllllllllllllllllllll
lllllllllllllllllllllllllllllllllllllllllllllllllllllllllllllllllllllllllllllllllllll
lllllll
lllllllllll
adidas Group ›079
Marketing Working Budget Down as a Percentage of Sales
Our Group’s marketing working budget is well balanced
between the major marketing components, which are com-
munication (including advertising, retail presentation and
public relations) and promotion partnerships. Marketing
working budget as a percentage of sales declined 1.3 per-
centage points to 12.9% in 2006 from 14.2% in the prior year,
mainly reflecting the first-time consolidation of Reebok.
Reebok’s marketing working budget as a percentage of sales
is significantly lower than Group average as a result of the
smaller portion of sales generated by performance products
in the Reebok segment. Excluding Reebok, marketing work-
ing budget as a percentage of sales declined 0.1 percent-
age points to reach 14.1%. This was related to a significant
decline of marketing expenditure as a percentage of sales
at TaylorMade-adidas Golf which more than compensated
higher marketing expenditures at brand adidas related to the
2006 FIFA World Cup™.
Operating Overheads Decrease as a Percentage of Sales
Group operating overheads include overhead costs related to
marketing, sales, logistics, research and development as well
as central finance and administration functions. Operating
overhead expenses as a percentage of sales declined 0.2 per-
centage points to 23.8% in 2006 from 24.0% in the prior year
as a result of the first-time consolidation of Reebok. Exclud-
ing Reebok, operating overheads as a percentage of sales
were stable at 24.0% as a result of lower administrative costs
within the Group’s headquarter functions which more than
offset higher own-retail expenditures at brand adidas.
No Amortization of Goodwill and Trademarks Incurred
In accordance with International Financial Reporting Stan-
dards, intangible assets with unlimited useful lives (goodwill
and trademarks) are tested annually and additionally when
there are indications of potential impairment. In 2006, as well
as in 2005, no impairment was incurred.
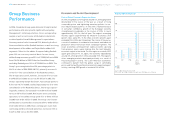
Operating Profit Grows 25%
Group operating margin declined 1.9 percentage points to
8.7% of sales in 2006 (2005: 10.7%). This mainly reflects the
first-time consolidation of the Reebok business, which carries
a significantly lower operating margin than the Group aver-
age. The segment’s operating margin also includes a nega-
tive impact from purchase price allocation on cost of sales
and operating expenses in a total amount of € 89 million. The
first cost synergies related to the Reebok integration, which
we expect to positively impact the Group’s operating margin
from 2007 onwards, were offset by one-time costs in 2006.
As a result of strong sales growth, however, operating profit
for the adidas Group rose 25% in 2006 to reach € 881 million
versus € 707 million in 2005. For the adidas Group exclud-
ing Reebok, the operating margin decreased 0.2 percentage
points to 10.5% in 2006 from 10.7% in the prior year. An oper-
ating margin decline in the Group’s HQ/Consolidation seg-
ment as a result of the Group’s cooperation agreement with
Amer Sports Corporation more than offset operating margin
increases at both adidas and TaylorMade-adidas Golf. Operat-
ing profit for the adidas Group excluding Reebok grew by 12%
to € 789 million in 2006 from € 707 million in the prior year.
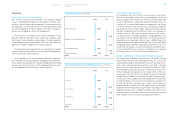
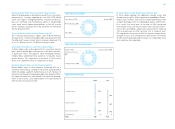
Operating Profit € in millions
20021)
20031)
20042)
20052)
20063)
477
490
584
707
881
1) Excluding royalty and commission income as well as goodwill amortization.
2) Figures reflect continuing operations as a result of the divestiture of the Salomon
business segment.
3) Including Reebok business segment from February 1, 2006 onwards, excluding
Greg Norman wholesale business from December 1, 2006 onwards.
Operating Margin in %
20021)
20031)
20042)
20052)
20063)
7.3
7.8
10.0
10.7
8.7
1) Excluding royalty and commission income as well as goodwill amortization.
2) Figures reflect continuing operations as a result of the divestiture of the Salomon
business segment.
3) Including Reebok business segment from February 1, 2006 onwards, excluding
Greg Norman wholesale business from December 1, 2006 onwards.
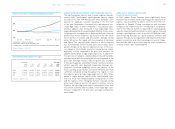
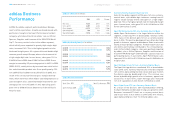
Operating Profit by Quarter € in millions
Q1 20051)
Q1 20062)
Q2 20051)
Q2 20063)
Q3 20051)
Q3 20063)
Q4 20051)
Q4 20064)
205
248
152
173
315
409
35
52
1) Figures reflect continuing operations as a result of the divestiture of the Salomon
business segment.
2) Including Reebok business segment from February 1, 2006 onwards.
3) Including Reebok business segment.
4) Including Reebok business segment, excluding Greg Norman wholesale business
from December 1, 2006 onwards.
» Income Statement