Reebok 2006 Annual Report Download - page 87
Download and view the complete annual report
Please find page 87 of the 2006 Reebok annual report below. You can navigate through the pages in the report by either clicking on the pages listed below, or by using the keyword search tool below to find specific information within the annual report.-
 1
1 -
2
-
3
-
4
-
5
-
6
-
7
-
8
-
9
-
10
-
11
-
12
-
13
-
14
-
15
-
16
-
17
-
18
-
19
-
20
-
21
-
22
-
23
-
24
-
25
-
26
-
27
-
28
-
29
-
30
-
31
-
32
-
33
-
34
-
35
-
36
-
37
-
38
-
39
-
40
-
41
-
42
-
43
-
44
-
45
-
46
-
47
-
48
-
49
-
50
-
51
-
52
-
53
-
54
-
55
-
56
-
57
-
58
-
59
-
60
-
61
-
62
-
63
-
64
-
65
-
66
-
67
-
68
-
69
-
70
-
71
-
72
-
73
-
74
-
75
-
76
-
 77
77 -
 78
78 -
 79
79 -
 80
80 -
 81
81 -
 82
82 -
 83
83 -
 84
84 -
 85
85 -
 86
86 -
 87
87 -
 88
88 -
 89
89 -
 90
90 -
 91
91 -
 92
92 -
 93
93 -
 94
94 -
 95
95 -
 96
96 -
 97
97 -
98
-
99
-
100
-
101
-
102
-
103
-
104
-
105
-
106
-
107
-
108
-
109
-
110
-
111
-
112
-
113
-
114
-
115
-
116
-
117
-
118
-
119
-
120
-
121
-
122
-
123
-
124
-
125
-
126
-
127
-
128
-
129
-
130
-
131
-
132
-
133
-
134
-
135
-
136
-
137
-
138
-
139
-
140
-
141
-
142
-
143
-
144
-
145
-
146
-
147
-
148
-
149
-
150
-
151
-
152
-
153
-
154
-
155
-
156
-
157
-
158
-
159
-
160
-
161
-
162
-
163
-
164
-
165
-
166
-
167
-
168
-
169
-
170
-
171
-
172
-
173
-
174
-
175
-
176
-
177
-
178
-
179
-
180
-
181
-
182
-
183
-
184
-
185
-
186
-
187
-
188
-
189
-
190
-
191
-
192
-
193
-
194
-
195
-
196
-
197
-
198
-
199
-
200
-
201
-
202
-
203
-
204
-
205
-
206
 |
 |
llllllllllllllllllllllllllllllllllllllllllll
lllllllllllllllllllllllllllllllllllllllllll
llllllllllllllllllllllllllllllllllllllllllllll
llllllllllllllllllllllllllllllllllllllllllllllllllllllllllll
lllllllllllllllllllllllllllllllllllllllllllllllllllllllllllllllllllllllllllllllllllllll
llllllllllllllllllllllllllllllllllllllllllllllllllllllllllllllll
llllllllllllllllllllllllllllllllllllllllllllllllllllllllllllll
lllllllllllllllllllllllllllllllllllllllllllllllllllllllllllll
lllllllllllllllllllllllllllllllllllllllllllllllllllllllllllllllllll
lllllllllllllllllllllllllllllllllllllllllllllllllllllllllllllllllllllllllllllllllllllll
lllllllllllllllllllllllllllllllllllllllllllllllllllllllllllllllllllllllllllllll
llllllllllllllllllllllllllllllllllllllllllllllllllllllllllllllllll
llllllllllllllllllllllllllllllllllllllllllllllllllllllllllllllll
lllllllllllllllllllllllllllllllllllllllllllllllllllllllllll
lllllllllllllllllllllllllllllllllllllllllllllllllllllllllllllllllllllllllllllllllllllll
adidas Group ›083
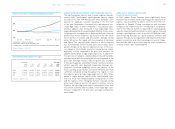
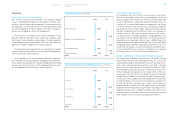
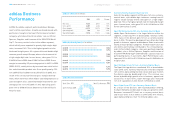
Total Assets Increase 46%
At the end of 2006, total assets increased 46% to € 8.379 bil-
lion versus € 5.750 billion in the prior year, mainly as a result
of the first-time inclusion of assets related to the Reebok
business.
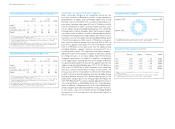
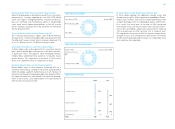
Inventories Up 31%
Group inventories increased 31% to € 1.607 billion in 2006
versus € 1.230 billion in 2005, largely as a result of the first-
time inclusion of € 404 million in inventories related to the
Reebok business. On a currency-neutral basis, this increase
was 41%. Inventories for the adidas Group excluding Reebok
declined 2% (+ 5% currency-neutral). The increase on a
currency-neutral basis reflects the Group’s growth expecta-
tions as well as higher inventory levels in Latin America in
advance of new import regulations in Brazil and Argentina.
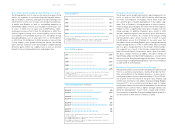
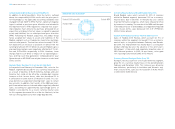
Receivables Grow 47%
Group receivables grew 47% (+ 57% currency-neutral) to
€ 1.415 billion at the end of 2006 versus € 965 million in the
prior year, primarily due to the first-time inclusion of receiv-
ables totaling € 461 million related to the Reebok business.
Receivables for the adidas Group excluding Reebok decreased
1% (+ 5% currency-neutral). The increase on a currency-
neutral basis is lower than sales growth during the fourth
quarter of 2006.
Other Current Assets Down 23%
Other current assets decreased 23% to € 413 million at the
end of 2006 from € 537 million in 2005. Other current assets
for the adidas Group excluding Reebok were down 40%, mainly
due to lower positive fair values of our financial instruments.
This more than offset the impact from the first-time inclusion
of other current assets in an amount of € 90 million related to
the Reebok business.
Fixed Assets Nearly Quadruple
Fixed assets increased by 274% to € 3.988 billion at the end
of 2006 versus € 1.065 billion in 2005, primarily related to the
first-time inclusion of Reebok. As a result of purchase price
allocation, intangible assets were capitalized in amounts of
€ 1.674 billion and € 1.165 billion related to trademarks and
other intangible assets as well as goodwill, respectively.
Other additions of € 301 million in 2006 were partly counter-
balanced by depreciation and amortization of € 217 million
and disposals in an amount of € 38 million. Assets amounting
to € 30 million were transferred to assets held for sale (see
Note 4, p. 155). Currency effects had a negative impact on
fixed assets in an amount of € 265 million.
Other Non-Current Assets Increase 10%
Other non-current assets increased 10% to € 134 million at
the end of 2006 from € 123 million in 2005, mainly reflecting
the first-time inclusion of € 6 million of other non-current
assets related to the Reebok business. Non-current assets for
the adidas Group excluding Reebok increased 5%, primarily
due to a higher non-current portion of prepaid promotion
contracts.
Accounts Payable Grow 10%
Accounts payable grew 10% (+ 20% currency-neutral) to
€ 752 million at the end of 2006 versus € 684 million in the
prior year, due to the first-time inclusion of payables total-
ing € 139 million related to the Reebok business. Payables
for the adidas Group excluding Reebok decreased 10% (– 2%
currency-neutral) versus the prior year. This decline reflects
the higher than usual year-end level in 2005 related to pay-
ables for a high volume of 2006 FIFA World Cup™ products.
Total Assets € in millions
2002
2003
20041)
2005
20062)
4,261
4,188
4,434
5,750
8,379
1) Restated due to application of amendment to IAS 19.
2) Including Reebok business.
Inventories € in millions
2002
2003
2004
2005
20061)
1,190
1,164
1,155
1,230
1,607
1) Including Reebok business.
Receivables € in millions
2002
2003
2004
2005
20061)
1,293
1,075
1,046
965
1,415
1) Including Reebok business.
» Balance Sheet and Cash Flow Statement