Reebok 2006 Annual Report Download - page 52
Download and view the complete annual report
Please find page 52 of the 2006 Reebok annual report below. You can navigate through the pages in the report by either clicking on the pages listed below, or by using the keyword search tool below to find specific information within the annual report.
› Structure and StrategyGroup Management Report ›
048 ANNUAL REPORT 2006 › adidas Group ›
Free Cash Flow
Internal Group
Management System
The adidas Group’s central planning and controlling system
is designed to continually increase the value of our Group
and brands to maximize shareholder value. By improv-
ing our top- and bottom-line performance and optimizing
the use of our capital employed, we aim to maximize free
cash flow generation, which is our principal financial goal.
Management utilizes a variety of decision-making tools to
assess our current performance and to align future stra-
tegic and investment decisions to exploit commercial and
organizational opportunities.
Free Cash Flow as Internal Group Management Focus
The cornerstone of our Group’s Internal Management Sys-
tem is our focus on free cash flow generation, which is an
important contributor to driving increases in shareholder
value. Free cash flow is comprised of operating components
(operating profit, change in operating working capital and
capital expenditures) as well as non-operating components
such as financial expenses and taxes. To maximize free cash
flow from our operating activities, we strive to increase Group
sales but also the Group’s gross and operating margins. To
implement this principle across our multi-brand organiza-
tion, brand management has direct responsibility for improv-
ing operating profit and the management of operating work-
ing capital and capital expenditure. Non-operating items
such as financial expenses and taxes are managed centrally
by the Group Treasury and Tax departments. To keep Group
and brand management focused on ongoing performance
improvement, variable compensation of the responsible man-
agers is linked to both operating profit and operating working
capital development.
Sales and Gross Margin Development Important
Performance Drivers
An essential element of our future operating performance is
maintaining and developing our strong top line. To achieve
this, Management focuses on identifying and exploiting op-
portunities that not only enhance growth, but also have
potential to increase gross margin (defined as gross profit as
a percentage of net sales) at the same time. Major levers for
gross margin improvement are ongoing improvements of the
Group’s product mix, the expansion of our high-margin own-
retail activities as well as the optimization of the geographic
mix of our business. In addition, the minimization of clear-
ance activities and ongoing supply chain efficiency gains, are
drivers for gross margin improvements of our Group.
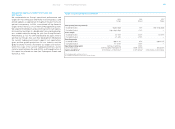
Free Cash Flow Components
Operating
Profit
Operating
Working
Capital
Capital
Expendi-
tures1)
Non-
Operating
Components
1) Excluding goodwill and finance leases.


