Reebok 2006 Annual Report Download - page 76
Download and view the complete annual report
Please find page 76 of the 2006 Reebok annual report below. You can navigate through the pages in the report by either clicking on the pages listed below, or by using the keyword search tool below to find specific information within the annual report.-
 1
1 -
2
-
3
-
4
-
5
-
6
-
7
-
8
-
9
-
10
-
11
-
12
-
13
-
14
-
15
-
16
-
17
-
18
-
19
-
20
-
21
-
22
-
23
-
24
-
25
-
26
-
27
-
28
-
29
-
30
-
31
-
32
-
33
-
34
-
35
-
36
-
37
-
38
-
39
-
40
-
41
-
42
-
43
-
44
-
45
-
46
-
47
-
48
-
49
-
50
-
51
-
52
-
53
-
54
-
55
-
56
-
57
-
58
-
59
-
60
-
61
-
62
-
63
-
64
-
65
-
 66
66 -
 67
67 -
 68
68 -
 69
69 -
 70
70 -
 71
71 -
 72
72 -
 73
73 -
 74
74 -
 75
75 -
 76
76 -
 77
77 -
 78
78 -
 79
79 -
 80
80 -
 81
81 -
 82
82 -
 83
83 -
 84
84 -
 85
85 -
 86
86 -
87
-
88
-
89
-
90
-
91
-
92
-
93
-
94
-
95
-
96
-
97
-
98
-
99
-
100
-
101
-
102
-
103
-
104
-
105
-
106
-
107
-
108
-
109
-
110
-
111
-
112
-
113
-
114
-
115
-
116
-
117
-
118
-
119
-
120
-
121
-
122
-
123
-
124
-
125
-
126
-
127
-
128
-
129
-
130
-
131
-
132
-
133
-
134
-
135
-
136
-
137
-
138
-
139
-
140
-
141
-
142
-
143
-
144
-
145
-
146
-
147
-
148
-
149
-
150
-
151
-
152
-
153
-
154
-
155
-
156
-
157
-
158
-
159
-
160
-
161
-
162
-
163
-
164
-
165
-
166
-
167
-
168
-
169
-
170
-
171
-
172
-
173
-
174
-
175
-
176
-
177
-
178
-
179
-
180
-
181
-
182
-
183
-
184
-
185
-
186
-
187
-
188
-
189
-
190
-
191
-
192
-
193
-
194
-
195
-
196
-
197
-
198
-
199
-
200
-
201
-
202
-
203
-
204
-
205
-
206
 |
 |

› Group Business PerformanceGroup Management Report ›
072 ANNUAL REPORT 2006 › adidas Group ›
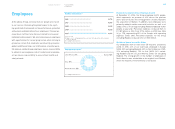
Group Business
Performance
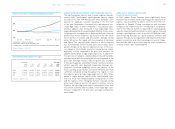
In 2006, the adidas Group again delivered strong financial
performance with sales growth significantly outpacing
Management’s initial expectations. Gross and operating
margin as well as net income attributable to sharehold-
ers developed in line with Management’s expectations.
Currency-neutral sales increased 53%, driven by the first-
time consolidation of the Reebok business as well as strong
development of the adidas and TaylorMade-adidas Golf
segments. Sales for the adidas Group excluding Reebok
grew 14% on a currency-neutral basis. In euro terms,
adidas Group revenues grew 52% to € 10.084 billion in 2006
from € 6.636 billion in 2005. Sales for the adidas Group
excluding Reebok grew 14% to € 7.548 billion in 2006. The
Group’s gross margin declined 3.6 percentage points to
44.6% of sales in 2006 (2005: 48.2%), primarily as a result
of the first-time consolidation of the Reebok business.
The Group’s gross profit, however, increased 41% to reach
€ 4.495 billion in 2006 versus € 3.197 billion in 2005. The
Group’s operating margin declined 1.9 percentage points to
8.7% from 10.7% in 2005, mainly impacted by the first-time
consolidation of the Reebok business. The Group’s operat-
ing profit, however, increased 25% to € 881 million in 2006
versus € 707 million in 2005. Net income from continuing
operations of the adidas Group grew 14% to € 496 million
in 2006 from € 434 million in 2005. The Group’s net income
attributable to shareholders increased 26% to € 483 million
from € 383 million in 2005. Basic earnings per share from
continuing and discontinued operations increased 16% to
€ 2.37 in 2006 versus € 2.05 in 2005.
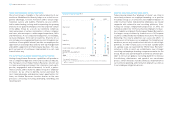
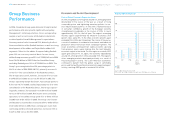
Economic and Sector Development
Rate of Global Economic Expansion Slows
In 2006, the global economy grew around 4%, although growth
decelerated in the course of the year as a result of rising
commodity prices and tightening monetary policies in sev-
eral industrialized countries. In line with a marked increase
in consumer confidence, growth of the European economy
strengthened considerably in the course of 2006 to reach
approximately 2.5% for the full year. The region’s emerging
markets again outperformed the Western economies with
growth rates above 5%. In the USA, economic growth again
exceeded 3% in 2006, but slowed over the course of the year as
a result of weakness in residential investment and industrial
production which more than offset solid export growth. The
Asian economies continued their stable economic upswing
from previous years, again making Asia the most dynamic
economic region in the world. For the region as a whole, GDP
again grew almost 8%. In Japan, the economy expanded by
around 2%, while growth in China exceeded 10%. The region’s
other emerging markets developed positively as a result of
flourishing export activity. The Latin American economies
continued to benefit from the global surge in commodity
prices and the healthy world economy which supported export
activity, reaching GDP growth of around 4.5% in 2006.
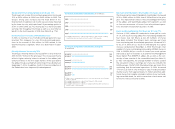
Regional GDP Development1)
10
8
6
4
2
0
EU USA Asia Japan China Latin
(excl. America
Japan)
2006
2005
Source: OECD, Allianz, Deutsche Bank
1) Real GDP, percentage change versus prior year; 2006 figures are estimated.