Reebok 2006 Annual Report Download - page 148
Download and view the complete annual report
Please find page 148 of the 2006 Reebok annual report below. You can navigate through the pages in the report by either clicking on the pages listed below, or by using the keyword search tool below to find specific information within the annual report.-
 1
1 -
2
-
3
-
4
-
5
-
6
-
7
-
8
-
9
-
10
-
11
-
12
-
13
-
14
-
15
-
16
-
17
-
18
-
19
-
20
-
21
-
22
-
23
-
24
-
25
-
26
-
27
-
28
-
29
-
30
-
31
-
32
-
33
-
34
-
35
-
36
-
37
-
38
-
39
-
40
-
41
-
42
-
43
-
44
-
45
-
46
-
47
-
48
-
49
-
50
-
51
-
52
-
53
-
54
-
55
-
56
-
57
-
58
-
59
-
60
-
61
-
62
-
63
-
64
-
65
-
66
-
67
-
68
-
69
-
70
-
71
-
72
-
73
-
74
-
75
-
76
-
77
-
78
-
79
-
80
-
81
-
82
-
83
-
84
-
85
-
86
-
87
-
88
-
89
-
90
-
91
-
92
-
93
-
94
-
95
-
96
-
97
-
98
-
99
-
100
-
101
-
102
-
103
-
104
-
105
-
106
-
107
-
108
-
109
-
110
-
111
-
112
-
113
-
114
-
115
-
116
-
117
-
118
-
119
-
120
-
121
-
122
-
123
-
124
-
125
-
126
-
127
-
128
-
129
-
130
-
131
-
132
-
133
-
134
-
135
-
136
-
137
-
 138
138 -
 139
139 -
 140
140 -
 141
141 -
 142
142 -
 143
143 -
 144
144 -
 145
145 -
 146
146 -
 147
147 -
 148
148 -
 149
149 -
 150
150 -
 151
151 -
 152
152 -
 153
153 -
 154
154 -
 155
155 -
 156
156 -
 157
157 -
 158
158 -
159
-
160
-
161
-
162
-
163
-
164
-
165
-
166
-
167
-
168
-
169
-
170
-
171
-
172
-
173
-
174
-
175
-
176
-
177
-
178
-
179
-
180
-
181
-
182
-
183
-
184
-
185
-
186
-
187
-
188
-
189
-
190
-
191
-
192
-
193
-
194
-
195
-
196
-
197
-
198
-
199
-
200
-
201
-
202
-
203
-
204
-
205
-
206
 |
 |

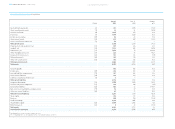
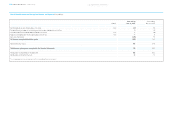
Consolidated Financial Statements ›
144 ANNUAL REPORT 2006 › adidas Group ›
Dec. 31 Dec. 31 Change
(Note) 2006 2005 in %
Cash and cash equivalents (6) 311 1,525 (79.6)
Short-term financial assets (7) 36 61 (40.8)
Accounts receivable (8) 1,415 965 46.6
Inventories (9) 1,607 1,230 30.7
Income tax receivables (28) 84 49 71.2
Other current assets (10) 413 537 (23.1)
Assets classified as held for sale (4) 59 — —
Total current assets 3,925 4,367 (10.1)
Property. plant and equipment, net (11) 689 424 62.3
Goodwill, net (12) 1,516 436 247.5
Trademarks , net (13) 1,454 15 9,664.2
Other intangible assets, net (13) 223 76 192,1
Long-term financial assets (14) 106 114 (7.5)
Deferred tax assets (28) 332 195 69.9
Other non-current assets (15) 134 123 10.0
Total non-current assets 4,454 1,383 221.9
Total assets 8,379 5,750 45.7
Accounts payable 752 684 10.0
Income taxes (28) 283 283 0.0
Accrued liabilities and provisions (17) 921 566 62.6
Other current liabilities (18) 232 190 22.0
Liabilities classified as held for sale (4) 4 — —
Total current liabilities 2,192 1,723 27.2
Long-term borrowings (16) 2,578 1,035 149.0
Pensions and similar obligations (19) 134 148 (9.2)
Deferred tax liabilities (28) 522 42 1138.1
Non-current accrued liabilities and provisions (17) 74 67 10.5
Other non-current liabilities (20) 43 23 87.2
Total non-current liabilities 3,351 1,315 154.8
Share capital 204 130 56.6
Reserves 425 700 (39.2)
Retained earnings 2,199 1,854 18.6
Shareholders’ equity (22) 2,828 2,684 5.4
Minority interests (21) 8 28 (73.2)
Total equity 2,836 2,712 4.6
Total liabilities and equity 8,379 5,750 45.7
Rounding differences may arise in percentages and totals.
The accompanying notes are an integral part of these consolidated financial statements.
Consolidated Balance Sheet € in millions