Reebok 2006 Annual Report Download - page 149
Download and view the complete annual report
Please find page 149 of the 2006 Reebok annual report below. You can navigate through the pages in the report by either clicking on the pages listed below, or by using the keyword search tool below to find specific information within the annual report.-
 1
1 -
2
-
3
-
4
-
5
-
6
-
7
-
8
-
9
-
10
-
11
-
12
-
13
-
14
-
15
-
16
-
17
-
18
-
19
-
20
-
21
-
22
-
23
-
24
-
25
-
26
-
27
-
28
-
29
-
30
-
31
-
32
-
33
-
34
-
35
-
36
-
37
-
38
-
39
-
40
-
41
-
42
-
43
-
44
-
45
-
46
-
47
-
48
-
49
-
50
-
51
-
52
-
53
-
54
-
55
-
56
-
57
-
58
-
59
-
60
-
61
-
62
-
63
-
64
-
65
-
66
-
67
-
68
-
69
-
70
-
71
-
72
-
73
-
74
-
75
-
76
-
77
-
78
-
79
-
80
-
81
-
82
-
83
-
84
-
85
-
86
-
87
-
88
-
89
-
90
-
91
-
92
-
93
-
94
-
95
-
96
-
97
-
98
-
99
-
100
-
101
-
102
-
103
-
104
-
105
-
106
-
107
-
108
-
109
-
110
-
111
-
112
-
113
-
114
-
115
-
116
-
117
-
118
-
119
-
120
-
121
-
122
-
123
-
124
-
125
-
126
-
127
-
128
-
129
-
130
-
131
-
132
-
133
-
134
-
135
-
136
-
137
-
138
-
 139
139 -
 140
140 -
 141
141 -
 142
142 -
 143
143 -
 144
144 -
 145
145 -
 146
146 -
 147
147 -
 148
148 -
 149
149 -
 150
150 -
 151
151 -
 152
152 -
 153
153 -
 154
154 -
 155
155 -
 156
156 -
 157
157 -
 158
158 -
 159
159 -
160
-
161
-
162
-
163
-
164
-
165
-
166
-
167
-
168
-
169
-
170
-
171
-
172
-
173
-
174
-
175
-
176
-
177
-
178
-
179
-
180
-
181
-
182
-
183
-
184
-
185
-
186
-
187
-
188
-
189
-
190
-
191
-
192
-
193
-
194
-
195
-
196
-
197
-
198
-
199
-
200
-
201
-
202
-
203
-
204
-
205
-
206
 |
 |
145
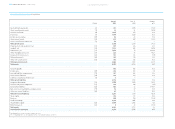
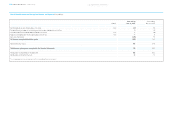
Year ending Year ending Year ending Dec. 31, Change
(Note) Dec. 31, 2006 Dec. 31, 2005 Change 2006 (excl. Reebok) (excl. Reebok)
Net sales 10,084 6,636 52.0% 7,548 13.7%
Cost of sales 5,589 3,439 62.6% 3,943 14.7%
Gross profit 4,495 3,197 40.6% 3,605 12.8%
(% of net sales) 44.6% 48.2% (3.6pp) 47.8% (0.4pp)
Royalty and commission income 90 47 90.9% 56 18.2%
Other operating income and expenses (11,13,25) 3,704 2,537 46.0% 2,872 13.2%
(% of net sales) 36.7% 38.2% (1.5pp) 38.0% (0.2pp)
Operating profit 881 707 24.5% 789 11.5%
(% of net sales) 8.7% 10.7% (1.9pp) 10.5% (0.2pp)
Financial income (27) 39 42 (5.5%)
Financial expenses (27) 197 94 110.7%
Income before taxes 723 655 10.3%
(% of net sales) 7.2% 9.9% (2.7pp)
Income taxes (28) 227 221 2.7%
(% of income before taxes) 31.4% 33.7% (2.3pp)
Net income from continuing operations 496 434 14.2%
(% of net sales) 4.9% 6.5% (1.6pp)
Income from discontinued operations, net of tax — (44) 100.0%
Net income 496 390 27.0%
(% of net sales) 4.9% 5.9% (1.0pp)
Net income attributable to shareholders 483 383 26.1%
(% of net sales) 4.8% 5.8% (1.0pp)
Net income attributable to minority interests 13 7 73.6%
Basic earnings per share from continuing operations (in €) 1) (29) 2.37 2.28 4.0%
Diluted earnings per share from continuing operations (in €) 1) (29) 2.25 2.15 4.9%
Basic earnings per share from continuing and
discontinued operations (in €) 1) (29) 2.37 2.05 15.9%
Diluted earnings per share from continuing and
discontinued operations (in €) 1) (29) 2.25 1.93 16.6%
Rounding differences may arise in percentages and totals.
The accompanying notes are an integral part of these consolidated financial statements.
1) Figures adjusted for 1: 4 share split conducted on June 6, 2006.
Consolidated Income Statement € in millions
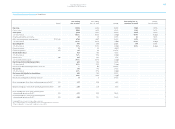
Consolidated Balance Sheet ›
Consolidated Income Statement ›