Reebok 2006 Annual Report Download - page 77
Download and view the complete annual report
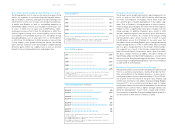
Please find page 77 of the 2006 Reebok annual report below. You can navigate through the pages in the report by either clicking on the pages listed below, or by using the keyword search tool below to find specific information within the annual report.-
 1
1 -
2
-
3
-
4
-
5
-
6
-
7
-
8
-
9
-
10
-
11
-
12
-
13
-
14
-
15
-
16
-
17
-
18
-
19
-
20
-
21
-
22
-
23
-
24
-
25
-
26
-
27
-
28
-
29
-
30
-
31
-
32
-
33
-
34
-
35
-
36
-
37
-
38
-
39
-
40
-
41
-
42
-
43
-
44
-
45
-
46
-
47
-
48
-
49
-
50
-
51
-
52
-
53
-
54
-
55
-
56
-
57
-
58
-
59
-
60
-
61
-
62
-
63
-
64
-
65
-
66
-
 67
67 -
 68
68 -
 69
69 -
 70
70 -
 71
71 -
 72
72 -
 73
73 -
 74
74 -
 75
75 -
 76
76 -
 77
77 -
 78
78 -
 79
79 -
 80
80 -
 81
81 -
 82
82 -
 83
83 -
 84
84 -
 85
85 -
 86
86 -
 87
87 -
88
-
89
-
90
-
91
-
92
-
93
-
94
-
95
-
96
-
97
-
98
-
99
-
100
-
101
-
102
-
103
-
104
-
105
-
106
-
107
-
108
-
109
-
110
-
111
-
112
-
113
-
114
-
115
-
116
-
117
-
118
-
119
-
120
-
121
-
122
-
123
-
124
-
125
-
126
-
127
-
128
-
129
-
130
-
131
-
132
-
133
-
134
-
135
-
136
-
137
-
138
-
139
-
140
-
141
-
142
-
143
-
144
-
145
-
146
-
147
-
148
-
149
-
150
-
151
-
152
-
153
-
154
-
155
-
156
-
157
-
158
-
159
-
160
-
161
-
162
-
163
-
164
-
165
-
166
-
167
-
168
-
169
-
170
-
171
-
172
-
173
-
174
-
175
-
176
-
177
-
178
-
179
-
180
-
181
-
182
-
183
-
184
-
185
-
186
-
187
-
188
-
189
-
190
-
191
-
192
-
193
-
194
-
195
-
196
-
197
-
198
-
199
-
200
-
201
-
202
-
203
-
204
-
205
-
206
 |
 |
adidas Group ›073
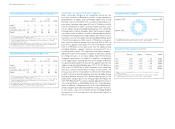
Regionally Mixed Development of Sporting Goods Industry
The sporting goods industry had a mixed regional develop-
ment in 2006. The European sporting goods industry largely
focused on the 2006 FIFA World Cup™, which helped to com-
pensate for subdued consumer spending in the first half
of the year. Nonetheless, footwear sales decreased at low-
single-digit rates in 2006 compared to the previous year,
whereas apparel sales increased at low-single-digit rates,
largely driven by the increased football offering. From a coun-
try perspective, strong growth in Spain and Italy was offset by
promotional market conditions particularly in the UK, which
led to declines in volume and price points. Average selling
prices fell across the region with the exception of Germany
and Spain. The sporting goods industry in North America
was dominated by a shift towards sport fusion styles which
gained strongly on the back of significant losses in the clas-
sics category. The footwear market increased by low-single-
digit rates in 2006 compared to the prior year, whereas the
apparel market grew at high-single-digit rates. In addition to
the sport fusion category, skateboarding increased markedly,
whereas basketball and running decreased compared to the
prior year. Amongst retailers, industry growth was strongest
in the sporting goods and family footwear channels, whereas
athletic specialty sales declined moderately. Average sell-
ing prices increased marginally across the industry. In the
Asian sporting goods market, consumer demand and retail
sentiment remained strong throughout the region, so that
the industry grew by high-single-digit rates in 2006. Stag-
nation in Japan and the region’s other industrialized coun-
tries was more than compensated by strong growth in China
and the region’s other emerging markets. Average selling
prices were stable in most of the region’s countries. In Latin
America, the sporting goods industry developed in line with
the overall economy and recorded a mid-single-digit sales
increase compared to the prior year. Average selling prices
were stable.
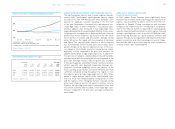
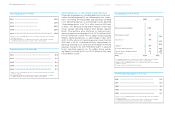
Exchange Rate Development1) € 1 equals
Average Average
rate Q1 Q2 Q3 Q4 rate
2005 2006 2006 2006 2006 2006
USD 1.2453 1.2104 1.2713 1.2660 1.3170 1.2562
GBP 0.6839 0.6964 0.6921 0.6777 0.6715 0.6820
JPY 136.91 142.42 145.75 149.34 156.93 146.08
1) Spot rates at quarter-end
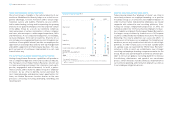
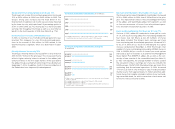
Quarterly Consumer Confidence Development by Region
130
100
70
Dec. 05 Mar. 06 Jun. 06 Sep. 06 Dec. 06
USA, Source: Conference Board
Euro Zone, Source: European Commission
Japan, Source: Economic and Social Research Institute, Government of Japan
1) Index: December 31, 2005 = 100
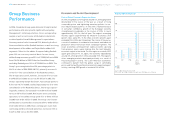
adidas Group Outpaces Industry and
Overall Economic Growth
In 2006, adidas Group revenues grew significantly faster
than both the economy and the sporting goods industry in all
regions, even excluding the effects from the first-time con-
solidation of Reebok. Private consumption and consumer
confidence are important factors contributing to the develop-
ment of our industry. In 2006, as expected, the sporting goods
industry outperformed the economy in most regions, boosted
by major sporting events such as the 2006 FIFA World Cup™,
and increasing demand for sports-inspired footwear and
apparel. Through our strong product offering, driven by major
product innovations and attractive designs in several catego-
ries, we were able to grow faster than our major competitors
in terms of both sales and profitability.
» Economic and Sector Development