Reebok 2006 Annual Report Download - page 75
Download and view the complete annual report
Please find page 75 of the 2006 Reebok annual report below. You can navigate through the pages in the report by either clicking on the pages listed below, or by using the keyword search tool below to find specific information within the annual report.-
 1
1 -
2
-
3
-
4
-
5
-
6
-
7
-
8
-
9
-
10
-
11
-
12
-
13
-
14
-
15
-
16
-
17
-
18
-
19
-
20
-
21
-
22
-
23
-
24
-
25
-
26
-
27
-
28
-
29
-
30
-
31
-
32
-
33
-
34
-
35
-
36
-
37
-
38
-
39
-
40
-
41
-
42
-
43
-
44
-
45
-
46
-
47
-
48
-
49
-
50
-
51
-
52
-
53
-
54
-
55
-
56
-
57
-
58
-
59
-
60
-
61
-
62
-
63
-
64
-
 65
65 -
 66
66 -
 67
67 -
 68
68 -
 69
69 -
 70
70 -
 71
71 -
 72
72 -
 73
73 -
 74
74 -
 75
75 -
 76
76 -
 77
77 -
 78
78 -
 79
79 -
 80
80 -
 81
81 -
 82
82 -
 83
83 -
 84
84 -
 85
85 -
86
-
87
-
88
-
89
-
90
-
91
-
92
-
93
-
94
-
95
-
96
-
97
-
98
-
99
-
100
-
101
-
102
-
103
-
104
-
105
-
106
-
107
-
108
-
109
-
110
-
111
-
112
-
113
-
114
-
115
-
116
-
117
-
118
-
119
-
120
-
121
-
122
-
123
-
124
-
125
-
126
-
127
-
128
-
129
-
130
-
131
-
132
-
133
-
134
-
135
-
136
-
137
-
138
-
139
-
140
-
141
-
142
-
143
-
144
-
145
-
146
-
147
-
148
-
149
-
150
-
151
-
152
-
153
-
154
-
155
-
156
-
157
-
158
-
159
-
160
-
161
-
162
-
163
-
164
-
165
-
166
-
167
-
168
-
169
-
170
-
171
-
172
-
173
-
174
-
175
-
176
-
177
-
178
-
179
-
180
-
181
-
182
-
183
-
184
-
185
-
186
-
187
-
188
-
189
-
190
-
191
-
192
-
193
-
194
-
195
-
196
-
197
-
198
-
199
-
200
-
201
-
202
-
203
-
204
-
205
-
206
 |
 |

llllllllllllllllllllllllllllllllllllllllllllllllllllllllllllllllllllllllllllllll
lllllllllllllllllllllllllllllllllllllllllllllllllllllllllllllllllllllllllllllllll
llllllllllllllllllllllllllllllllllllllllllllllllllllllll
llllllllllllllllllllllllllllllllllllllllllllllllllllllllllll
llllllllllllllllllllllllllllllllllllllllllllllllllllllllllllllllllllllllllllllllllllllllllll
lllllllllllllllllllllllllllllllllllllllllllllllllllllllllllllllllllllllllllllllllllll
llllllllllllllllllllllllllllllllllllllllllllllllllllllllllllllllllllllllllllllllllllllllllll
llllllllllllllllllllllllllllllllllllllllllllllllllllllllllllllllll
lllllllllllllllllllllllllllllllllllllllllllllllllllllllllll
llllllllllllllllllllllllllllllllllllllllllllllllllllllllllllllllll
lllllllllllllllllllllllllllllllllllllllllllllllllllllllllllllllllllllllllllllllllllllllll
llllllllllllllllllllllllllllllllllllllllllllllllllllllllllllllllllllllllllllllllllllllllllll
lllllllllllllllllllllllllllllllllllllllllllllllllllllllllllllllll
llllllllllllllllllllllllllllllllllllllllllllllllllllllllllllll
lllllllllllllllllllllllllllllllllllllllllllllllllllllllllllllllll
071
First-Time Consolidation of Reebok Impacts R&D Expenses
Given the short product lifecycles in the sporting goods
industry, R&D costs at the adidas Group are recognized as
expense in the period in which they are incurred and are not
capitalized. The increase in employees, primarily as a result
of the acquisition of Reebok, drove R&D expenses higher by
56% to € 98 million in 2006 (2005: € 63 million). For the Group
excluding Reebok, R&D expenses increased 14% to € 72 mil-
lion. In 2006, R&D expenses represented 2.6% of total operat-
ing expenses versus 2.4% in the prior year. R&D expenses as
a percentage of sales increased slightly to 1.0% from 0.9%
in 2005. Other related expenses for product development and
market research, for example, were incurred as part of the
Group’s other operating overheads.
Active Trademark and Patent Protection Policy
To capitalize on the Group’s R&D achievements, we seek to
gain trademark and patent protection for our key products,
technologies and innovations in all major markets for foot-
wear, apparel and hardware. We hold registered trademark
rights or have applied for trademark protection for the Group’s
brands and other proprietary names in most countries around
the world. Our business is not dependent upon any single pat-
ent or licensed technology. As part of our business policy, we
rigorously defend the adidas Group’s trademarks and patents
by monitoring and prosecuting infringements of trademark
and patent rights around the world (see Risk Report, p. 96).
Successful Product Introductions Highlight R&D Strength
Developing industry-leading technologies is only one aspect
of being an innovation leader. Even more important is the suc-
cessful commercialization of those technological innovations.
The majority of the adidas Group’s sales in 2006 were gen-
erated with products newly introduced in the course of the
year. At brand adidas, products launched in 2006 accounted
for 79% of brand sales. Only 5% of total sales were gener-
ated with products introduced three or more years ago. Two
examples of how adidas transformed technological innova-
tions into commercial success in 2006 are the first modu-
lar football boot +F50 TUNIT and the +Teamgeist™ match
ball of the 2006 FIFA World Cup™. After being launched in
the market in March 2006, sales of the +F50 TUNIT football
boot clearly surpassed our original targets. Similarly, after
successfully launching the +Teamgeist™ in December 2005
featuring a completely new 14-panel configuration, sales fig-
ures clearly exceeded our original targets. An example of how
Reebok successfully commercialized R&D efforts in 2006 is
the Trinity KFS running shoe introduced in 2006, featuring
both the innovative KFS upper material construction and DMX
cushioning. This shoe was very well received at retail and won
the prestigious Global Runner’s World Editor’s Choice award.
In the TaylorMade-adidas Golf segment, current products (i.e.
products launched in the last 18 months, which is the typical
product lifecycle in golf) represented 79% of total sales. Prod-
ucts that had been brought to market three or more years ago
accounted for 8% of TaylorMade-adidas Golf sales. As in prior
years, all our brands will launch several new highlight prod-
ucts during the course of 2007 featuring major technologies
(see Subsequent Events and Outlook, p. 106).
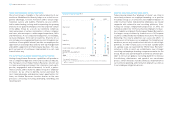
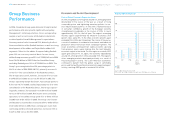
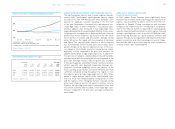
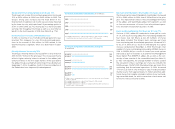
R&D Expenses € in millions
20021)
20031)
20042)
20052)
20063)
85
86
59
63
98
1) Including Salomon business segment which was more research intensive due to its
significant hard goods exposure.
2) Figures reflect continuing operations as a result of the divestiture of the Salomon
business segment.
3) Including Reebok business segment from February 1, 2006 onwards, excluding Greg
Norman wholesale business from December 1, 2006 onwards.
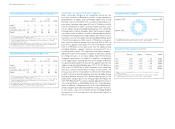
R&D Expenses in % of Net Sales
20021)
20031)
20042)
20052)
20063)
1.3
1.4
1.0
0.9
1.0
1) Including Salomon business segment which was more research intensive due to its
significant hard goods exposure.
2) Figures reflect continuing operations as a result of the divestiture of the Salomon
business segment.
3) Including Reebok business segment from February 1, 2006 onwards, excluding Greg
Norman wholesale business from December 1, 2006 onwards.
R&D Expenses in % of Operating Expenses
20021)
20031)
20042)
20052)
20063)
3.6
3.7
2.6
2.4
2.6
1) Including Salomon business segment which was more research intensive due to its
significant hard goods exposure.
2) Figures reflect continuing operations as a result of the divestiture of the Salomon
business segment.
3) Including Reebok business segment from February 1, 2006 onwards, excluding Greg
Norman wholesale business from December 1, 2006 onwards.
» Research & Development
Corporate Functions ›