Reebok 2006 Annual Report Download - page 117
Download and view the complete annual report
Please find page 117 of the 2006 Reebok annual report below. You can navigate through the pages in the report by either clicking on the pages listed below, or by using the keyword search tool below to find specific information within the annual report.-
 1
1 -
2
-
3
-
4
-
5
-
6
-
7
-
8
-
9
-
10
-
11
-
12
-
13
-
14
-
15
-
16
-
17
-
18
-
19
-
20
-
21
-
22
-
23
-
24
-
25
-
26
-
27
-
28
-
29
-
30
-
31
-
32
-
33
-
34
-
35
-
36
-
37
-
38
-
39
-
40
-
41
-
42
-
43
-
44
-
45
-
46
-
47
-
48
-
49
-
50
-
51
-
52
-
53
-
54
-
55
-
56
-
57
-
58
-
59
-
60
-
61
-
62
-
63
-
64
-
65
-
66
-
67
-
68
-
69
-
70
-
71
-
72
-
73
-
74
-
75
-
76
-
77
-
78
-
79
-
80
-
81
-
82
-
83
-
84
-
85
-
86
-
87
-
88
-
89
-
90
-
91
-
92
-
93
-
94
-
95
-
96
-
97
-
98
-
99
-
100
-
101
-
102
-
103
-
104
-
105
-
106
-
 107
107 -
 108
108 -
 109
109 -
 110
110 -
 111
111 -
 112
112 -
 113
113 -
 114
114 -
 115
115 -
 116
116 -
 117
117 -
 118
118 -
 119
119 -
 120
120 -
 121
121 -
 122
122 -
 123
123 -
 124
124 -
 125
125 -
 126
126 -
 127
127 -
128
-
129
-
130
-
131
-
132
-
133
-
134
-
135
-
136
-
137
-
138
-
139
-
140
-
141
-
142
-
143
-
144
-
145
-
146
-
147
-
148
-
149
-
150
-
151
-
152
-
153
-
154
-
155
-
156
-
157
-
158
-
159
-
160
-
161
-
162
-
163
-
164
-
165
-
166
-
167
-
168
-
169
-
170
-
171
-
172
-
173
-
174
-
175
-
176
-
177
-
178
-
179
-
180
-
181
-
182
-
183
-
184
-
185
-
186
-
187
-
188
-
189
-
190
-
191
-
192
-
193
-
194
-
195
-
196
-
197
-
198
-
199
-
200
-
201
-
202
-
203
-
204
-
205
-
206
 |
 |
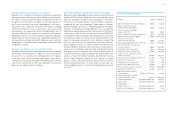
Medium-Term Cost Synergies from Reebok Integration
During our integration planning phase, we have identified an
annual cost of sales and operating expense synergy potential
in an amount of € 175 million. We expect to realize the full
savings effect by 2009. In particular, we project cost savings
to come from the following areas:
» Cost of sales: By integrating Reebok into our Global Oper-
ations function, we see the potential to achieve a cost of sales
reduction of € 75 million through scale advantages on pur-
chasing by 2009.
» Sales and marketing, distribution, administration and IT:
We have also identified the opportunity to generate € 100 mil-
lion in operating expense savings by realizing various ini-
tiatives such as joint media buying, co-locating sales and
global operations teams throughout most of Europe and Asia,
harmonizing and consolidating our SAP systems, eliminat-
ing duplicative corporate functions and sharing finance and
administrative services across the Group.
We expect to generate 50% of the targeted synergies in 2007
and the full 100% as of 2008. To generate these annual sav-
ings we estimate remaining one-time costs of € 140 million,
50% of which are to occur in 2007 and 50% in 2008.
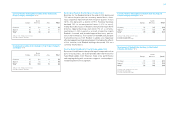
Phasing of Integration Revenue Synergies € in millions
2007 2008 2009
Incremental annual
revenue 100 250 500
Average one-time
cost per year 15 – 25 15 – 25 15 – 25
Phasing of Integration Cost Synergies € in millions
2007 2008 2009
Annual cost saving 87.5 175 175
One-time cost per year 70 70 —
Net effect 17.5 105 175
Annual currency-neutral sales growth high-single-digit
Gross margin 46 to 48%
Operating margin approx. 11%
Annual net income growth double-digit
Group Medium-Term Financial Targets to 2009
Strong Medium-Term Outlook
As a result of continued underlying growth of our brands and
the synergies from the Reebok integration, we expect a strong
top- and bottom-line development over the medium term. We
project sales for the Group to increase at high-single-digit
rates on a currency-neutral basis in 2008 and 2009, respec-
tively. This development will be driven by continued strength at
adidas and TaylorMade-adidas Golf as well as a revitalization
of the Reebok business segment. The Group’s gross margin
is expected to grow annually to a corridor of between 46 and
48% in 2009, driven by increases at all brands. In particular,
this development will reflect positive effects from an improv-
ing product and geographical mix, own-retail expansion and
cost of sales synergies derived as a result of the integration
of Reebok. In the medium term, we also expect the Group’s
operating margin to increase to approximately 11% in 2009,
driven by improvements at all brands. Efficiency gains related
to the integration of the Reebok business segment will play
a major role in this development. Net income is expected to
increase by double-digit rates in 2008 and 2009, respectively,
as a result of our continuing top-line growth and improved
profitability projected at all brands.
113