Reebok 2006 Annual Report Download - page 195
Download and view the complete annual report
Please find page 195 of the 2006 Reebok annual report below. You can navigate through the pages in the report by either clicking on the pages listed below, or by using the keyword search tool below to find specific information within the annual report.-
 1
1 -
2
-
3
-
4
-
5
-
6
-
7
-
8
-
9
-
10
-
11
-
12
-
13
-
14
-
15
-
16
-
17
-
18
-
19
-
20
-
21
-
22
-
23
-
24
-
25
-
26
-
27
-
28
-
29
-
30
-
31
-
32
-
33
-
34
-
35
-
36
-
37
-
38
-
39
-
40
-
41
-
42
-
43
-
44
-
45
-
46
-
47
-
48
-
49
-
50
-
51
-
52
-
53
-
54
-
55
-
56
-
57
-
58
-
59
-
60
-
61
-
62
-
63
-
64
-
65
-
66
-
67
-
68
-
69
-
70
-
71
-
72
-
73
-
74
-
75
-
76
-
77
-
78
-
79
-
80
-
81
-
82
-
83
-
84
-
85
-
86
-
87
-
88
-
89
-
90
-
91
-
92
-
93
-
94
-
95
-
96
-
97
-
98
-
99
-
100
-
101
-
102
-
103
-
104
-
105
-
106
-
107
-
108
-
109
-
110
-
111
-
112
-
113
-
114
-
115
-
116
-
117
-
118
-
119
-
120
-
121
-
122
-
123
-
124
-
125
-
126
-
127
-
128
-
129
-
130
-
131
-
132
-
133
-
134
-
135
-
136
-
137
-
138
-
139
-
140
-
141
-
142
-
143
-
144
-
145
-
146
-
147
-
148
-
149
-
150
-
151
-
152
-
153
-
154
-
155
-
156
-
157
-
158
-
159
-
160
-
161
-
162
-
163
-
164
-
165
-
166
-
167
-
168
-
169
-
170
-
171
-
172
-
173
-
174
-
175
-
176
-
177
-
178
-
179
-
180
-
181
-
182
-
183
-
184
-
 185
185 -
 186
186 -
 187
187 -
 188
188 -
 189
189 -
 190
190 -
 191
191 -
 192
192 -
 193
193 -
 194
194 -
 195
195 -
 196
196 -
 197
197 -
 198
198 -
 199
199 -
 200
200 -
 201
201 -
 202
202 -
 203
203 -
 204
204 -
 205
205 -
206
 |
 |

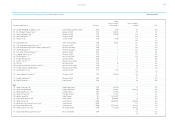
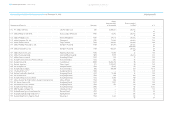
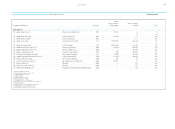
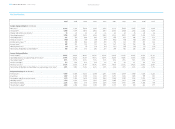
191
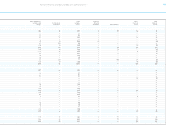
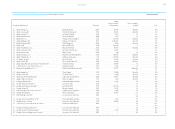
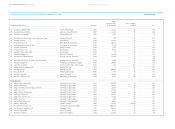
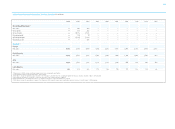
adidas Group Segmental Information: Ten-Year Overview € in millions
2006 2005 2004 2003 2002 2001 2000 1999 1998 1997
Discontinued Operations 4)
Net sales — 360 618 — — — — — — —
Gross profit — 137 245 — — — — — — —
Gross margin — 38.1% 39.6% — — — — — — —
Operating profit — (21) (7) — — — — — — —
Operating margin — (5.9%) (1.2%) — — — — — — —
Operating assets — — 654 — — — — — — —
REGIONS 5) 6)
Europe
Net sales 4,162 3,166 3,068 3,365 3,200 3,066 2,860 2,723 2,774 2,102
North America
Net sales 3,234 1,561 1,332 1,562 1,960 1,818 1,906 1,826 1,784 869
Asia
Net sales 2,020 1,523 1,192 1,116 1,166 1,010 875 663 383 359
Latin America
Net sales 499 319 224 179 163 178 171 126 112 86
1) Figures prior to 2004 exclude royalty and commission income and goodwill amortization.
2) Consolidated in adidas Group from February 1, 2006 onwards.
3) 2006 figures include Greg Norman apparel business from February 1 until November 30, excluding Greg Norman wholesale business from December 1, 2006 onwards.
4) Discontinued operations are shown as a result of the divestiture of the Salomon business segment.
5) 2004 and 2005 reflect continuing operations as a result of the divestiture of the Salomon business segment
6) 2006 figures include Reebok business segment from February 1. 2006 onwards and exclude Greg Norman wholesale business from December 1, 2006 onwards.