Reebok 2006 Annual Report Download - page 80
Download and view the complete annual report
Please find page 80 of the 2006 Reebok annual report below. You can navigate through the pages in the report by either clicking on the pages listed below, or by using the keyword search tool below to find specific information within the annual report.-
 1
1 -
2
-
3
-
4
-
5
-
6
-
7
-
8
-
9
-
10
-
11
-
12
-
13
-
14
-
15
-
16
-
17
-
18
-
19
-
20
-
21
-
22
-
23
-
24
-
25
-
26
-
27
-
28
-
29
-
30
-
31
-
32
-
33
-
34
-
35
-
36
-
37
-
38
-
39
-
40
-
41
-
42
-
43
-
44
-
45
-
46
-
47
-
48
-
49
-
50
-
51
-
52
-
53
-
54
-
55
-
56
-
57
-
58
-
59
-
60
-
61
-
62
-
63
-
64
-
65
-
66
-
67
-
68
-
69
-
 70
70 -
 71
71 -
 72
72 -
 73
73 -
 74
74 -
 75
75 -
 76
76 -
 77
77 -
 78
78 -
 79
79 -
 80
80 -
 81
81 -
 82
82 -
 83
83 -
 84
84 -
 85
85 -
 86
86 -
 87
87 -
 88
88 -
 89
89 -
 90
90 -
91
-
92
-
93
-
94
-
95
-
96
-
97
-
98
-
99
-
100
-
101
-
102
-
103
-
104
-
105
-
106
-
107
-
108
-
109
-
110
-
111
-
112
-
113
-
114
-
115
-
116
-
117
-
118
-
119
-
120
-
121
-
122
-
123
-
124
-
125
-
126
-
127
-
128
-
129
-
130
-
131
-
132
-
133
-
134
-
135
-
136
-
137
-
138
-
139
-
140
-
141
-
142
-
143
-
144
-
145
-
146
-
147
-
148
-
149
-
150
-
151
-
152
-
153
-
154
-
155
-
156
-
157
-
158
-
159
-
160
-
161
-
162
-
163
-
164
-
165
-
166
-
167
-
168
-
169
-
170
-
171
-
172
-
173
-
174
-
175
-
176
-
177
-
178
-
179
-
180
-
181
-
182
-
183
-
184
-
185
-
186
-
187
-
188
-
189
-
190
-
191
-
192
-
193
-
194
-
195
-
196
-
197
-
198
-
199
-
200
-
201
-
202
-
203
-
204
-
205
-
206
 |
 |
› Group Business PerformanceGroup Management Report ›
076 ANNUAL REPORT 2006 › adidas Group ›
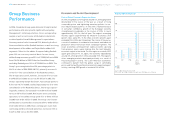
Strong Sales Increase in All Product Categories
Sales increased strongly in all categories, driven by the
first-time inclusion of Reebok as well as strong operational
developments at adidas and TaylorMade-adidas Golf. Group
footwear sales increased 60% on a currency-neutral basis. In
euro terms, footwear sales grew 59% to € 4.733 billion in 2006
from € 2.978 billion in 2005. Currency-neutral footwear sales
for the adidas Group excluding Reebok grew 10%, driven by
strong growth in nearly all adidas Sport Performance catego-
ries, particularly in football, as well as double-digit increases
in the Sport Heritage division and in adidas Golf. In euro terms,
footwear sales for the adidas Group excluding Reebok grew
10% to € 3.263 billion in 2006 from € 2.978 billion in the prior
year. Currency-neutral apparel sales were up 48% in 2006. In
euro terms, apparel sales grew 47% to € 4.105 billion in 2006
from € 2.798 billion in the prior year. For the adidas Group
excluding Reebok, apparel revenues increased 20% on a
currency-neutral basis. This represents the highest underly-
ing growth rate for this product category in nine years, driven
by strong increases in all major adidas Sport Performance
categories, particularly in football. In addition, solid growth
in the adidas Sport Heritage division and in adidas Golf drove
this positive development. In euro terms, apparel sales for the
adidas Group excluding Reebok grew 19% to € 3.322 billion in
2006 from € 2.798 billion in 2005. Hardware sales increased
45% on a currency-neutral basis in 2006. In euro terms, the
increase was 45% to € 1.246 billion in 2006 from € 860 million
in 2005. Currency-neutral hardware sales for the adidas Group
excluding Reebok were up 13%. Double-digit growth in the
adidas balls category due to the strong product offering at the
2006 FIFA World Cup™ as well as double-digit growth rates in
irons and golf balls at TaylorMade drove this strong develop-
ment. In addition, solid growth rates in the TaylorMade metal-
woods category positively impacted the strong sales increase.
In euro terms, sales for the adidas Group excluding Reebok
increased 12% to € 963 million in 2006 from € 860 million in
the prior year.
1) Including Reebok business segment from February 1, 2006 onwards, excluding
Greg Norman wholesale business from December 1, 2006 onwards.
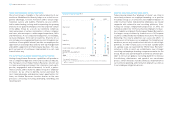
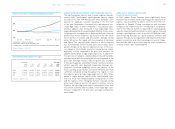
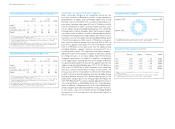
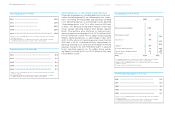
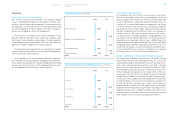
Net Sales by Product Category1)
Hardware 12% Footwear 47%
Apparel 41%
Footwear Apparel Hardware Total
2002 2,851 2,288 1,385 6,523
2003 2,767 2,222 1,278 6,267
20041) 2,620 2,462 778 5,860
20051) 2,978 2,798 860 6,636
20062) 4,733 4,105 1,246 10,084
1) Figures reflect continuing operations as a result of the divestiture of the Salomon
business segment.
2) Including Reebok business segment from February 1, 2006 onwards, excluding
Greg Norman wholesale business from December 1, 2006 onwards.
Net Sales by Product Category € in millions
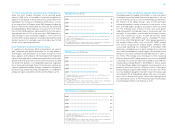
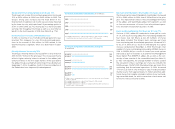
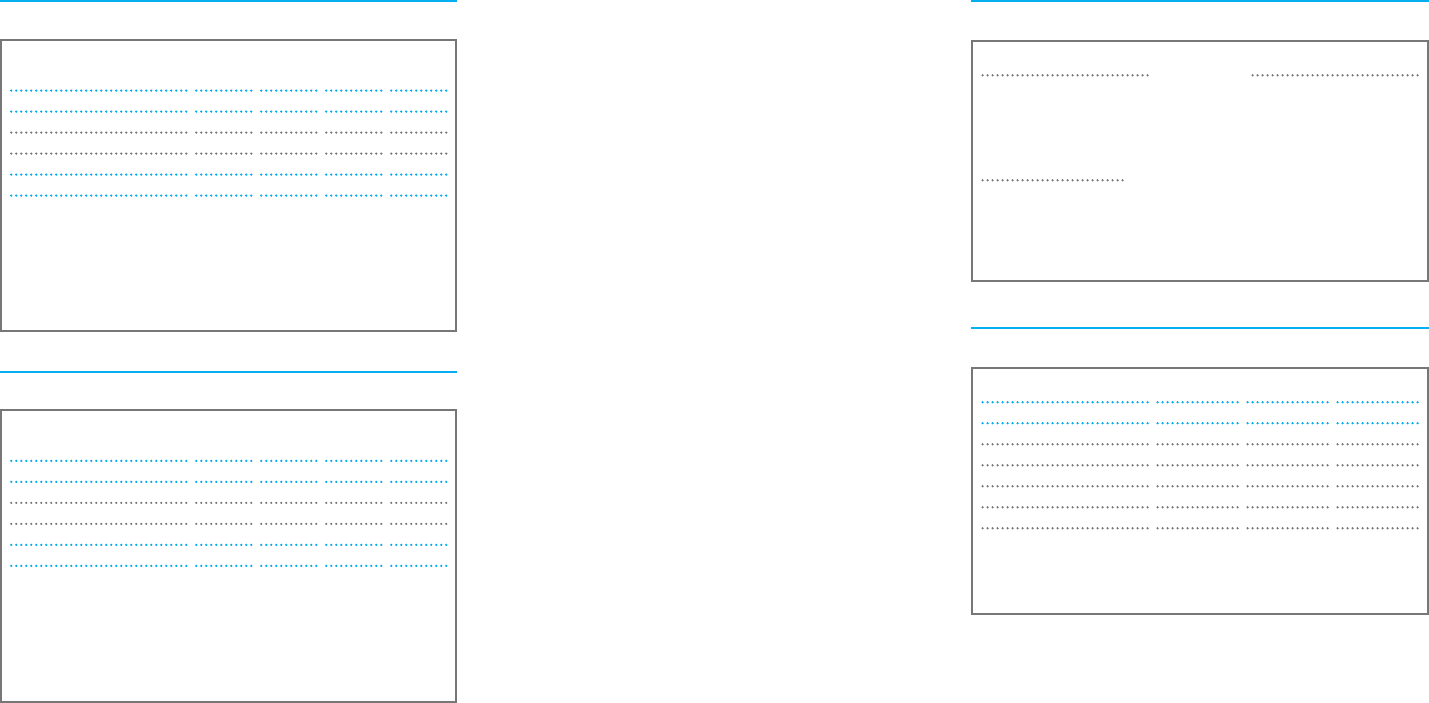
Net Sales Growth in € by Segment and Region1) in %
North Latin
Europe America Asia America Total
adidas 9 12 18 37 13
Reebok2)
TaylorMade-adidas Golf
3) (10) 32 15 45 21
Total4) 31 107 33 56 52
1) Versus the prior year. Figures reflect continuing operations as a result of the divestiture
of the Salomon business segment in 2005.
2) Included from February 1, 2006 onwards. 2005 Reebok net sales were not consolidated
within the adidas Group. For details regarding net sales development see Reebok
Business Performance, p. 91.
3) Including Greg Norman apparel business from February 1, 2006 to November 30, 2006.
4) Including Reebok business segment from February 1, 2006 onwards, excluding Greg
Norman wholesale business from December 1, 2006 onwards.
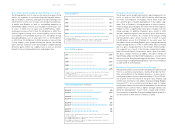
Currency-Neutral Net Sales Growth by Segment and Region1) in %
North Latin
Europe America Asia America Total
adidas 9 13 20 33 14
Reebok2)
TaylorMade-adidas Golf
3) (9) 32 18 47 22
Total4) 32 107 35 53 53
1) Versus the prior year. Figures reflect continuing operations as a result of the divestiture
of the Salomon business segment in 2005.
2) Included from February 1, 2006 onwards. 2005 Reebok net sales were not consolidated
within the adidas Group. For details regarding net sales development see Reebok
Business Performance, p. 91.
3) Including Greg Norman apparel business from February 1, 2006 to November 30, 2006.
4) Including Reebok business segment from February 1, 2006 onwards, excluding Greg
Norman wholesale business from December 1, 2006 onwards.