Kodak 2008 Annual Report Download - page 97
Download and view the complete annual report
Please find page 97 of the 2008 Kodak annual report below. You can navigate through the pages in the report by either clicking on the pages listed below, or by using the keyword search tool below to find specific information within the annual report.-
 1
1 -
2
-
3
-
4
-
5
-
6
-
7
-
8
-
9
-
10
-
11
-
12
-
13
-
14
-
15
-
16
-
17
-
18
-
19
-
20
-
21
-
22
-
23
-
24
-
25
-
26
-
27
-
28
-
29
-
30
-
31
-
32
-
33
-
34
-
35
-
36
-
37
-
38
-
39
-
40
-
41
-
42
-
43
-
44
-
45
-
46
-
47
-
48
-
49
-
50
-
51
-
52
-
53
-
54
-
55
-
56
-
57
-
58
-
59
-
60
-
61
-
62
-
63
-
64
-
65
-
66
-
67
-
68
-
69
-
70
-
71
-
72
-
73
-
74
-
75
-
76
-
77
-
78
-
79
-
80
-
81
-
82
-
83
-
84
-
85
-
86
-
 87
87 -
 88
88 -
 89
89 -
 90
90 -
 91
91 -
 92
92 -
 93
93 -
 94
94 -
 95
95 -
 96
96 -
 97
97 -
 98
98 -
 99
99 -
 100
100 -
 101
101 -
 102
102 -
 103
103 -
 104
104 -
 105
105 -
 106
106 -
 107
107 -
108
-
109
-
110
-
111
-
112
-
113
-
114
-
115
-
116
-
117
-
118
-
119
-
120
-
121
-
122
-
123
-
124
-
125
-
126
-
127
-
128
-
129
-
130
-
131
-
132
-
133
-
134
-
135
-
136
-
137
-
138
-
139
-
140
-
141
-
142
-
143
-
144
-
145
-
146
-
147
-
148
-
149
-
150
-
151
-
152
-
153
-
154
-
155
-
156
-
157
-
158
-
159
-
160
-
161
-
162
-
163
-
164
-
165
-
166
-
167
-
168
-
169
-
170
-
171
-
172
-
173
-
174
-
175
-
176
-
177
-
178
-
179
-
180
-
181
-
182
-
183
-
184
-
185
-
186
-
187
-
188
-
189
-
190
-
191
-
192
-
193
-
194
-
195
-
196
-
197
-
198
-
199
-
200
-
201
-
202
-
203
-
204
-
205
-
206
-
207
-
208
-
209
-
210
-
211
-
212
-
213
-
214
-
215
-
216
 |
 |

95
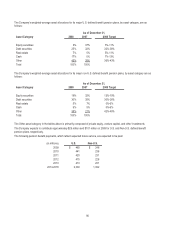
Under the 1995 Plan, 22 million shares of the Company’s common stock were eligible for grant to a variety of employees between
February 1, 1995 and December 31, 1999. The options generally expire ten years from the date of grant, but may expire sooner if
the optionee’s employment terminates. The 1995 Plan provided for, but was not limited to, grants of unvested stock, performance
awards, and SARs, either in tandem with options or freestanding. As of December 31, 2008, 10,086 freestanding SARs were
outstanding under the 1995 Plan at option prices ranging from $31.30 to $73.06. Compensation expense recognized for the years
ended December 31, 2008, 2007, or 2006 on those freestanding SARs was not material.
Further information relating to stock options is as follows:
Shares
Weighted-Average
Under Range of Price
Exercise
(Amounts in thousands, except per share amounts) Option Per Share
Price Per Share
Outstanding on December 31, 2005 36,043 $22.03 - $92.31
$47.54
Granted 1,605 $20.12 - $27.70
$25.48
Exercised 20 $22.58 - $26.71
$24.97
Terminated, Canceled, Surrendered 3,017 $22.03 - $83.19
$58.46
Outstanding on December 31, 2006 34,611 $20.12 - $92.31
$45.57
Granted 1,813 $23.28 - $28.44
$23.50
Exercised 235 $22.58 - $27.70
$24.91
Terminated, Canceled, Surrendered 5,296 $23.25 - $92.31
$73.22
Outstanding on December 31, 2007 30,893 $20.12 - $87.59
$39.70
Granted 2,813 $7.41 - $18.55
$7.60
Exercised 0 N/A
N/A
Terminated, Canceled, Surrendered 8,499 $20.12 - $87.59
$52.78
Outstanding on December 31, 2008 25,207 $7.41 - $79.63
$31.71
Exercisable on December 31, 2006 31,548 $22.58 - $92.31
$47.44
Exercisable on December 31, 2007 27,546 $20.12 - $87.59
$41.51
Exercisable on December 31, 2008 20,772 $21.93 - $79.63
$35.56
The following table summarizes information about stock options as of December 31, 2008:
(Number of options in thousands)
Options Outstanding Options Exercisable
Range of Exercise Weighted-Average
Prices Remaining
At Less Contractual Life Weighted-Average Weighted-Average
Least Than Options (Years) Exercise Price Options Exercise Price
$ 5 - $20 2,813 6.93 $7.60 0 N/A
$20 - $30 6,124 4.0 $25.37 4,502 $25.83
$30 - $40 12,607 2.51 $32.78 12,607 $32.78
$40 - $50 567 2.08 $41.71 567 $41.71
$50 - $60 1,511 1.23 $54.82 1,511 $54.82
$60 - $70 1,518 0.38 $64.37 1,518 $64.37
$70 - $80 67 0.72 $74.80 67 $74.80
25,207 20,772
The weighted-average remaining contractual term and aggregate intrinsic value of all options outstanding at December 31, 2008 was
3.17 years and negative $633 million, respectively. The weighted-average remaining contractual term and aggregate intrinsic value
of all options exercisable at December 31, 2008 was 2.49 years and negative $602 million, respectively. The negative aggregate
intrinsic value of all options outstanding and exercisable, respectively, reflects the fact that the market price of the Company's
common stock as of December 31, 2008 was below the weighted-average exercise price of options. The total intrinsic value of
options exercised during years ended December 31, 2008, 2007 and 2006 was $0, $1 million, and $0, respectively.