Kodak 2008 Annual Report Download - page 92
Download and view the complete annual report
Please find page 92 of the 2008 Kodak annual report below. You can navigate through the pages in the report by either clicking on the pages listed below, or by using the keyword search tool below to find specific information within the annual report.-
 1
1 -
2
-
3
-
4
-
5
-
6
-
7
-
8
-
9
-
10
-
11
-
12
-
13
-
14
-
15
-
16
-
17
-
18
-
19
-
20
-
21
-
22
-
23
-
24
-
25
-
26
-
27
-
28
-
29
-
30
-
31
-
32
-
33
-
34
-
35
-
36
-
37
-
38
-
39
-
40
-
41
-
42
-
43
-
44
-
45
-
46
-
47
-
48
-
49
-
50
-
51
-
52
-
53
-
54
-
55
-
56
-
57
-
58
-
59
-
60
-
61
-
62
-
63
-
64
-
65
-
66
-
67
-
68
-
69
-
70
-
71
-
72
-
73
-
74
-
75
-
76
-
77
-
78
-
79
-
80
-
81
-
 82
82 -
 83
83 -
 84
84 -
 85
85 -
 86
86 -
 87
87 -
 88
88 -
 89
89 -
 90
90 -
 91
91 -
 92
92 -
 93
93 -
 94
94 -
 95
95 -
 96
96 -
 97
97 -
 98
98 -
 99
99 -
 100
100 -
 101
101 -
 102
102 -
103
-
104
-
105
-
106
-
107
-
108
-
109
-
110
-
111
-
112
-
113
-
114
-
115
-
116
-
117
-
118
-
119
-
120
-
121
-
122
-
123
-
124
-
125
-
126
-
127
-
128
-
129
-
130
-
131
-
132
-
133
-
134
-
135
-
136
-
137
-
138
-
139
-
140
-
141
-
142
-
143
-
144
-
145
-
146
-
147
-
148
-
149
-
150
-
151
-
152
-
153
-
154
-
155
-
156
-
157
-
158
-
159
-
160
-
161
-
162
-
163
-
164
-
165
-
166
-
167
-
168
-
169
-
170
-
171
-
172
-
173
-
174
-
175
-
176
-
177
-
178
-
179
-
180
-
181
-
182
-
183
-
184
-
185
-
186
-
187
-
188
-
189
-
190
-
191
-
192
-
193
-
194
-
195
-
196
-
197
-
198
-
199
-
200
-
201
-
202
-
203
-
204
-
205
-
206
-
207
-
208
-
209
-
210
-
211
-
212
-
213
-
214
-
215
-
216
 |
 |

90
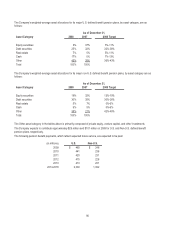
The Company's weighted-average asset allocations for its major U.S. defined benefit pension plans, by asset category, are as
follows:
As of December 31,
Asset Category 2008 2007 2008 Target
Equity securities 6% 37% 5%-11%
Debt securities 25% 32% 32%-38%
Real estate 7% 5% 5%-11%
Cash 17% 0% 7%-13%
Other 45% 26% 36%-43%
Total 100% 100%
The Company's weighted-average asset allocations for its major non-U.S. defined benefit pension plans, by asset category are as
follows:
As of December 31,
Asset Category 2008 2007 2008 Target
Equity securities 18% 32% 13%-19%
Debt securities 30% 35% 30%-36%
Real estate 5% 7% 0%-6%
Cash 9% 5% 0%-6%
Other 38% 21% 42%-48%
Total 100% 100%
The Other asset category in the tables above is primarily composed of private equity, venture capital, and other investments.
The Company expects to contribute approximately $29 million and $101 million in 2009 for U.S. and Non-U.S. defined benefit
pension plans, respectively.
The following pension benefit payments, which reflect expected future service, are expected to be paid:
(in millions) U.S. Non-U.S.
2009 $ 465 $ 246
2010 441 236
2011 420 231
2012 415 226
2013 410 221
2014-2018 2,000 1,092