Kodak 2008 Annual Report Download - page 45
Download and view the complete annual report
Please find page 45 of the 2008 Kodak annual report below. You can navigate through the pages in the report by either clicking on the pages listed below, or by using the keyword search tool below to find specific information within the annual report.-
 1
1 -
2
-
3
-
4
-
5
-
6
-
7
-
8
-
9
-
10
-
11
-
12
-
13
-
14
-
15
-
16
-
17
-
18
-
19
-
20
-
21
-
22
-
23
-
24
-
25
-
26
-
27
-
28
-
29
-
30
-
31
-
32
-
33
-
34
-
 35
35 -
 36
36 -
 37
37 -
 38
38 -
 39
39 -
 40
40 -
 41
41 -
 42
42 -
 43
43 -
 44
44 -
 45
45 -
 46
46 -
 47
47 -
 48
48 -
 49
49 -
 50
50 -
 51
51 -
 52
52 -
 53
53 -
 54
54 -
 55
55 -
56
-
57
-
58
-
59
-
60
-
61
-
62
-
63
-
64
-
65
-
66
-
67
-
68
-
69
-
70
-
71
-
72
-
73
-
74
-
75
-
76
-
77
-
78
-
79
-
80
-
81
-
82
-
83
-
84
-
85
-
86
-
87
-
88
-
89
-
90
-
91
-
92
-
93
-
94
-
95
-
96
-
97
-
98
-
99
-
100
-
101
-
102
-
103
-
104
-
105
-
106
-
107
-
108
-
109
-
110
-
111
-
112
-
113
-
114
-
115
-
116
-
117
-
118
-
119
-
120
-
121
-
122
-
123
-
124
-
125
-
126
-
127
-
128
-
129
-
130
-
131
-
132
-
133
-
134
-
135
-
136
-
137
-
138
-
139
-
140
-
141
-
142
-
143
-
144
-
145
-
146
-
147
-
148
-
149
-
150
-
151
-
152
-
153
-
154
-
155
-
156
-
157
-
158
-
159
-
160
-
161
-
162
-
163
-
164
-
165
-
166
-
167
-
168
-
169
-
170
-
171
-
172
-
173
-
174
-
175
-
176
-
177
-
178
-
179
-
180
-
181
-
182
-
183
-
184
-
185
-
186
-
187
-
188
-
189
-
190
-
191
-
192
-
193
-
194
-
195
-
196
-
197
-
198
-
199
-
200
-
201
-
202
-
203
-
204
-
205
-
206
-
207
-
208
-
209
-
210
-
211
-
212
-
213
-
214
-
215
-
216
 |
 |

43
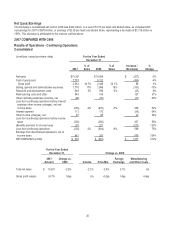
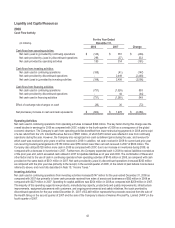
Liquidity and Capital Resources
2008
Cash Flow Activity
For the Year Ended
(in millions) December 31,
2008 2007 Change
Cash flows from operating activities:
Net cash (used in) provided by continuing operations $ (143) $ 351 $ (494)
Net cash provided by (used in) discontinued operations 296 (37) 333
Net cash provided by operating activities 153 314 (161)
Cash flows from investing activities:
Net cash used in continuing operations (188) (41) (147)
Net cash provided by discontinued operations - 2,449 (2,449)
Net cash (used in) provided by investing activities (188) 2,408 (2,596)
Cash flows from financing activities:
Net cash used in continuing operations (731) (1,324) 593
Net cash provided by discontinued operations - 44 (44)
Net cash used in financing activities (731) (1,280) 549
Effect of exchange rate changes on cash (36) 36 (72)
Net (decrease) increase in cash and cash equivalents $ (802) $ 1,478 $ (2,280)
Operating Activities
Net cash used in continuing operations from operating activities increased $494 million. The key factor driving this change was the
overall decline in earnings for 2008 as compared with 2007, notably in the fourth quarter of 2008 as a consequence of the global
economic downturn. The Company's cash from operating activities benefited from lower restructuring payments in 2008 and receipt
of a tax refund from the U.S. Internal Revenue Service of $581 million, of which $270 million was reflected in loss from continuing
operations during the year. However, the Company also recognized non-cash curtailment gains during the year, and revenue for
which cash was received in prior years or will be received in 2009. In addition, net cash received in 2008 for current and prior year
non-recurring licensing arrangements of $150 million was $156 million lower than net cash received in 2007 of $306 million. The
Company also utilized $128 million more cash in 2008 as compared with 2007, due to an increase in inventories during 2008, as
compared with a decrease in inventories in 2007. Furthermore, the Company expended cash in 2008 to reduce liabilities recorded as
of the prior year end, which exceeded cash utilized in 2007 to liquidate liabilities as of year end 2006. The combination of these and
other factors led to the use of cash in continuing operations from operating activities of $143 million in 2008, as compared with cash
provided on the same basis of $351 million in 2007. Net cash provided by (used in) discontinued operations increased $333 million
as compared with the prior year due primarily to the receipt, in the second quarter of 2008, of the refund of past federal income taxes
referred to above, and more fully described in Note 15, “Income Taxes.”
Investing Activities
Net cash used in continuing operations from investing activities increased $147 million for the year ended December 31, 2008 as
compared with 2007 due primarily to lower cash proceeds received from sales of assets and businesses of $92 million in 2008 as
compared with $227 million in 2007. Spending for capital additions was $254 million in 2008 as compared with $259 million in 2007.
The majority of this spending supports new products, manufacturing capacity, productivity and quality improvements, infrastructure
improvements, equipment placements with customers, and ongoing environmental and safety initiatives. Net cash provided by
discontinued operations for the year ended December 31, 2007 of $2,449 million represents the proceeds received from the sale of
the Health Group in the second quarter of 2007 and the sale of the Company’s shares of Hermes Precisa Pty. Limited (“HPA”) in the
fourth quarter of 2007.