Kodak 2008 Annual Report Download - page 167
Download and view the complete annual report
Please find page 167 of the 2008 Kodak annual report below. You can navigate through the pages in the report by either clicking on the pages listed below, or by using the keyword search tool below to find specific information within the annual report.-
 1
1 -
2
-
3
-
4
-
5
-
6
-
7
-
8
-
9
-
10
-
11
-
12
-
13
-
14
-
15
-
16
-
17
-
18
-
19
-
20
-
21
-
22
-
23
-
24
-
25
-
26
-
27
-
28
-
29
-
30
-
31
-
32
-
33
-
34
-
35
-
36
-
37
-
38
-
39
-
40
-
41
-
42
-
43
-
44
-
45
-
46
-
47
-
48
-
49
-
50
-
51
-
52
-
53
-
54
-
55
-
56
-
57
-
58
-
59
-
60
-
61
-
62
-
63
-
64
-
65
-
66
-
67
-
68
-
69
-
70
-
71
-
72
-
73
-
74
-
75
-
76
-
77
-
78
-
79
-
80
-
81
-
82
-
83
-
84
-
85
-
86
-
87
-
88
-
89
-
90
-
91
-
92
-
93
-
94
-
95
-
96
-
97
-
98
-
99
-
100
-
101
-
102
-
103
-
104
-
105
-
106
-
107
-
108
-
109
-
110
-
111
-
112
-
113
-
114
-
115
-
116
-
117
-
118
-
119
-
120
-
121
-
122
-
123
-
124
-
125
-
126
-
127
-
128
-
129
-
130
-
131
-
132
-
133
-
134
-
135
-
136
-
137
-
138
-
139
-
140
-
141
-
142
-
143
-
144
-
145
-
146
-
147
-
148
-
149
-
150
-
151
-
152
-
153
-
154
-
155
-
156
-
 157
157 -
 158
158 -
 159
159 -
 160
160 -
 161
161 -
 162
162 -
 163
163 -
 164
164 -
 165
165 -
 166
166 -
 167
167 -
 168
168 -
 169
169 -
 170
170 -
 171
171 -
 172
172 -
 173
173 -
 174
174 -
 175
175 -
 176
176 -
 177
177 -
178
-
179
-
180
-
181
-
182
-
183
-
184
-
185
-
186
-
187
-
188
-
189
-
190
-
191
-
192
-
193
-
194
-
195
-
196
-
197
-
198
-
199
-
200
-
201
-
202
-
203
-
204
-
205
-
206
-
207
-
208
-
209
-
210
-
211
-
212
-
213
-
214
-
215
-
216
 |
 |
41
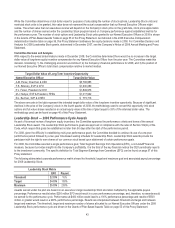
If the Company achieved both of the target goals, the corporate pool would fund at 100%. If either threshold goal was not achieved, the
corporate pool would not be funded and our Named Executive Officers will not earn a bonus under the plan.
Committee Discussion and Analysis
The Committee selected the two primary metrics because they are key operational metrics for the Company and are among the metrics
our CEO periodically reports to the investment community. They provide insight to the Company’s ability to generate cash to invest in
organic and non-organic growth as well as the continued growth of the Company’s digital businesses.
The Committee established the Net Cash Generation threshold at $50 million to provide a level of positive cash flow (after dividends), while
still providing the flexibility to make investments to drive growth in our digital businesses. Further, the target of $300 million was consistent
with the midpoint of the Net Cash Generation range communicated to investors, as adjusted for dividends. The Committee established the
target for CDG and GCG year-over-year percent revenue growth at the low end of the range communicated to investors (7%), because it
was consistent with prior full-year digital revenue growth after reflecting the realignment of two analog business product groups. The
threshold was established at 4% revenue growth, which was the midpoint of the range communicated to investors in 2007.
In the creation of the matrix, the Committee increased the rate of payout for digital revenue growth above 8.5%. The Committee felt that an
accelerated payout for performance above 8.5% was appropriate because it represented performance above the midpoint of the revenue
growth communicated to investors and was a challenging objective given the strong full year growth the Company achieved in 2007. In
addition, the Committee set the matrix so that the rate of payout was relatively flat for results delivered within the range communicated to
investors and which increased or decreased more steeply outside the range. The Committee selected this payout rate to reinforce the
importance of delivering net cash generation within the target range shared with investors.
As discussed above, the Committee also established a set of baseline metrics in 2008. The Committee chose these metrics because they
reflected key strategic and operational imperatives for the year in support of the Company’s business strategy. The metrics were selected
in part to ensure that the primary EXCEL performance metrics were not achieved at the expense of the longer-term interest of
shareholders.
Determination of Corporate Award Pool for 2008
The Company ended 2008 with a negative $144 million Net Cash Generation and a negative 4% Combined CDG and GCG year-over-year
percentage digital revenue growth.
Committee Decision and Analysis
Given that the result for each EXCEL performance metric was below threshold, the Committee determined that the matrix produced a
funding pool of 0%. The Committee reviewed the results of the baseline metrics but, in light of the below-threshold results in Net Cash
Generation and digital revenue growth, the Committee did not factor in the results of the baseline metrics in its determination of the funding
pool.
Because the EXCEL matrix resulted in a corporate funding pool of 0%, and because the Committee did not factor in the baseline metric
results, none of our Named Executive Officers earned an EXCEL award for 2008.
Long-Term Equity Incentive Compensation
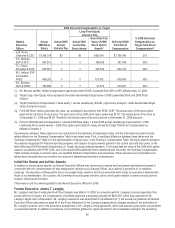
Our Named Executive Officers receive an annual grant of long-term equity incentive awards as described further below. In addition to
these awards, Named Executive Officers may receive additional equity awards during the year in recognition of a promotion or other
significant achievement. All equity awards are issued under the 2005 Omnibus Long-Term Compensation Plan.
Purpose
The objectives of our long-term equity incentive programs are to:
1) Align executive compensation with shareholder interests;
2) Create significant incentives for executive retention;
3) Encourage long-term performance by our executives; and
4) Promote stock ownership.
The Committee reviews our long-term equity incentive programs annually to ensure that they are meeting the intended objectives.
Over the last several years, in connection with our digital transformation, the Committee implemented a compensation strategy designed to
increase the proportion of our Named Executive Officers’ total direct compensation delivered in the form of long-term equity incentive
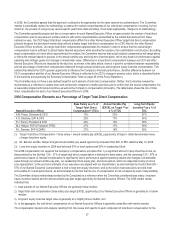
awards. For 2008, the percentage of our Named Executive Officer’s target total direct compensation that is based upon the long-term
equity program ranges from 55% to 67% (as seen on the chart titled “2008 Compensation Elements as a Percentage of Target Total Direct
Compensation” on page 37 of this Proxy Statement), underscoring the alignment of the interests of our Named Executive Officers with the
interests of the Company’s shareholders.