Kodak 2008 Annual Report Download - page 49
Download and view the complete annual report
Please find page 49 of the 2008 Kodak annual report below. You can navigate through the pages in the report by either clicking on the pages listed below, or by using the keyword search tool below to find specific information within the annual report.-
 1
1 -
2
-
3
-
4
-
5
-
6
-
7
-
8
-
9
-
10
-
11
-
12
-
13
-
14
-
15
-
16
-
17
-
18
-
19
-
20
-
21
-
22
-
23
-
24
-
25
-
26
-
27
-
28
-
29
-
30
-
31
-
32
-
33
-
34
-
35
-
36
-
37
-
38
-
 39
39 -
 40
40 -
 41
41 -
 42
42 -
 43
43 -
 44
44 -
 45
45 -
 46
46 -
 47
47 -
 48
48 -
 49
49 -
 50
50 -
 51
51 -
 52
52 -
 53
53 -
 54
54 -
 55
55 -
 56
56 -
 57
57 -
 58
58 -
 59
59 -
60
-
61
-
62
-
63
-
64
-
65
-
66
-
67
-
68
-
69
-
70
-
71
-
72
-
73
-
74
-
75
-
76
-
77
-
78
-
79
-
80
-
81
-
82
-
83
-
84
-
85
-
86
-
87
-
88
-
89
-
90
-
91
-
92
-
93
-
94
-
95
-
96
-
97
-
98
-
99
-
100
-
101
-
102
-
103
-
104
-
105
-
106
-
107
-
108
-
109
-
110
-
111
-
112
-
113
-
114
-
115
-
116
-
117
-
118
-
119
-
120
-
121
-
122
-
123
-
124
-
125
-
126
-
127
-
128
-
129
-
130
-
131
-
132
-
133
-
134
-
135
-
136
-
137
-
138
-
139
-
140
-
141
-
142
-
143
-
144
-
145
-
146
-
147
-
148
-
149
-
150
-
151
-
152
-
153
-
154
-
155
-
156
-
157
-
158
-
159
-
160
-
161
-
162
-
163
-
164
-
165
-
166
-
167
-
168
-
169
-
170
-
171
-
172
-
173
-
174
-
175
-
176
-
177
-
178
-
179
-
180
-
181
-
182
-
183
-
184
-
185
-
186
-
187
-
188
-
189
-
190
-
191
-
192
-
193
-
194
-
195
-
196
-
197
-
198
-
199
-
200
-
201
-
202
-
203
-
204
-
205
-
206
-
207
-
208
-
209
-
210
-
211
-
212
-
213
-
214
-
215
-
216
 |
 |

47
The Company issues indemnifications in certain instances when it sells businesses and real estate, and in the ordinary course of
business with its customers, suppliers, service providers and business partners. Further, the Company indemnifies its directors and
officers who are, or were, serving at the Company's request in such capacities. Historically, costs incurred to settle claims related to
these indemnifications have not been material to the Company’s financial position, results of operations or cash flows. Additionally,
the fair value of the indemnifications that the Company issued during the year ended December 31, 2008 was not material to the
Company’s financial position, results of operations or cash flows.
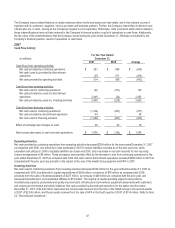
2007
Cash Flow Activity
For the Year Ended
(in millions) December 31,
2007 2006 Change
Cash flows from operating activities:
Net cash provided by continuing operations $ 351 $ 685 $ (334)
Net cash (used in) provided by discontinued
operations (37) 271 (308)
Net cash provided by operating activities 314 956 (642)
Cash flows from investing activities:
Net cash used in continuing operations (41) (181) 140
Net cash provided by (used in) discontinued
operations 2,449 (44) 2,493
Net cash provided by (used in) investing activities 2,408 (225) 2,633
Cash flows from financing activities:
Net cash used in continuing operations (1,324) (947) (377)
Net cash provided by discontinued operations 44 - 44
Net cash used in financing activities (1,280) (947) (333)
Effect of exchange rate changes on cash 36 20 16
Net increase (decrease) in cash and cash equivalents $ 1,478 $ (196) $ 1,674
Operating Activities
Net cash provided by continuing operations from operating activities decreased $334 million for the year ended December 31, 2007
as compared with 2006, due primarily to cash expended in 2007 to reduce liabilities recorded as of the prior year end, which
exceeded cash utilized in 2006 to liquidate liabilities as of year-end 2005, and a decrease in net cash received for non-recurring
license arrangements of $9 million. These decreases were partially offset by the decrease in loss from continuing operations for the
year ended December 31, 2007 as compared with 2006. Net cash used in discontinued operations increased $308 million in 2007 as
compared with the prior year due primarily to the impact of the sale of the Health Group segment and HPA in 2007.
Investing Activities
Net cash used in continuing operations from investing activities decreased $140 million for the year ended December 31, 2007 as
compared with 2006, due primarily to capital expenditures of $259 million, a reduction of $76 million as compared with 2006,
proceeds from the sales of businesses/assets of $227 million, an increase of $49 million as compared with the prior year, and
decreased investments in unconsolidated affiliates of $19 million. The majority of capital spending supports new products,
manufacturing capacity, productivity and quality improvements, infrastructure improvement, equipment placements with customers,
and ongoing environmental and safety initiatives. Net cash provided by discontinued operations for the twelve months ended
December 31, 2007 of $2,449 million represents the net proceeds received from the sale of the Health Group in the second quarter
of 2007 of $2,335 million, and the proceeds received from the sale of HPA in the fourth quarter of 2007 of $114 million. Refer to Note
22, “Discontinued Operations.”