Kodak 2008 Annual Report Download - page 50
Download and view the complete annual report
Please find page 50 of the 2008 Kodak annual report below. You can navigate through the pages in the report by either clicking on the pages listed below, or by using the keyword search tool below to find specific information within the annual report.-
 1
1 -
2
-
3
-
4
-
5
-
6
-
7
-
8
-
9
-
10
-
11
-
12
-
13
-
14
-
15
-
16
-
17
-
18
-
19
-
20
-
21
-
22
-
23
-
24
-
25
-
26
-
27
-
28
-
29
-
30
-
31
-
32
-
33
-
34
-
35
-
36
-
37
-
38
-
39
-
 40
40 -
 41
41 -
 42
42 -
 43
43 -
 44
44 -
 45
45 -
 46
46 -
 47
47 -
 48
48 -
 49
49 -
 50
50 -
 51
51 -
 52
52 -
 53
53 -
 54
54 -
 55
55 -
 56
56 -
 57
57 -
 58
58 -
 59
59 -
 60
60 -
61
-
62
-
63
-
64
-
65
-
66
-
67
-
68
-
69
-
70
-
71
-
72
-
73
-
74
-
75
-
76
-
77
-
78
-
79
-
80
-
81
-
82
-
83
-
84
-
85
-
86
-
87
-
88
-
89
-
90
-
91
-
92
-
93
-
94
-
95
-
96
-
97
-
98
-
99
-
100
-
101
-
102
-
103
-
104
-
105
-
106
-
107
-
108
-
109
-
110
-
111
-
112
-
113
-
114
-
115
-
116
-
117
-
118
-
119
-
120
-
121
-
122
-
123
-
124
-
125
-
126
-
127
-
128
-
129
-
130
-
131
-
132
-
133
-
134
-
135
-
136
-
137
-
138
-
139
-
140
-
141
-
142
-
143
-
144
-
145
-
146
-
147
-
148
-
149
-
150
-
151
-
152
-
153
-
154
-
155
-
156
-
157
-
158
-
159
-
160
-
161
-
162
-
163
-
164
-
165
-
166
-
167
-
168
-
169
-
170
-
171
-
172
-
173
-
174
-
175
-
176
-
177
-
178
-
179
-
180
-
181
-
182
-
183
-
184
-
185
-
186
-
187
-
188
-
189
-
190
-
191
-
192
-
193
-
194
-
195
-
196
-
197
-
198
-
199
-
200
-
201
-
202
-
203
-
204
-
205
-
206
-
207
-
208
-
209
-
210
-
211
-
212
-
213
-
214
-
215
-
216
 |
 |

48
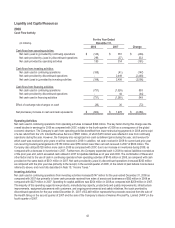
Financing Activities
Net cash used in financing activities increased $333 million for the year ended December 31, 2007 as compared with 2006, due to
higher net repayments of borrowings, mainly due to the repayment of the Company’s Secured Term Debt in the second quarter of
2007 that was required as a result of the sale of the Health Group.
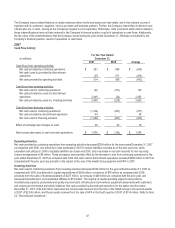
2006
Cash Flow Activity
For the Year Ended
(in millions) December 31,
2006 2005 Change
Cash flows from operating activities:
Net cash provided by continuing operations $ 685 $ 722 $ (37)
Net cash provided by discontinued operations 271 486 (215)
Net cash provided by operating activities 956 1,208 (252)
Cash flows from investing activities:
Net cash used in continuing operations (181) (1,264) 1,083
Net cash used in discontinued operations (44) (40) (4)
Net cash used in investing activities (225) (1,304) 1,079
Cash flows from financing activities:
Net cash (used in) provided by financing operations (947) 533 (1,480)
Effect of exchange rate changes on cash 20 (27) 47
Net (decrease) increase in cash and cash equivalents $ (196) $ 410 $ (606)
Operating Activities
Net cash provided by continuing operations from operating activities decreased $37 million for the year ended December 31, 2006
as compared with 2005, due primarily to the recognition of deferred income on intellectual property arrangements in 2006, for which
cash was received in 2007, partially offset by the year-over-year decline in inventories due to planned inventory reductions driven by
corporate initiatives and the decline in demand for traditional products. Net cash provided by discontinued operations decreased
$215 million as compared with the prior year due primarily to the results of the operations of the Health Group segment, and the
reversal of certain tax accruals in 2005 as a result of a settlement between the Company and the Internal Revenue Service on the
audit of the tax years 1993 through 1998. These tax accruals had been established in 1994 in connection with the Company’s sale of
its pharmaceutical, consumer health and household products businesses during that year.
Investing Activities
Net cash used in continuing operations from investing activities decreased $1,083 million for the year ended December 31, 2006 as
compared with 2005, due primarily to the acquisitions of Creo, Inc. and Kodak Polychrome Graphics in 2005.
Financing Activities
Net cash used in financing activities increased $1,480 million for the year ended December 31, 2006 as compared with 2005, due to
the net repayment of $803 million of debt in 2006.
Other
Refer to Note 10, "Commitments and Contingencies" in the Notes to Financial Statements for discussion regarding the Company's
undiscounted liabilities for environmental remediation costs, asset retirement obligations, and other commitments and contingencies
including legal matters.