Kodak 2008 Annual Report Download - page 27
Download and view the complete annual report
Please find page 27 of the 2008 Kodak annual report below. You can navigate through the pages in the report by either clicking on the pages listed below, or by using the keyword search tool below to find specific information within the annual report.-
 1
1 -
2
-
3
-
4
-
5
-
6
-
7
-
8
-
9
-
10
-
11
-
12
-
13
-
14
-
15
-
16
-
 17
17 -
 18
18 -
 19
19 -
 20
20 -
 21
21 -
 22
22 -
 23
23 -
 24
24 -
 25
25 -
 26
26 -
 27
27 -
 28
28 -
 29
29 -
 30
30 -
 31
31 -
 32
32 -
 33
33 -
 34
34 -
 35
35 -
 36
36 -
 37
37 -
38
-
39
-
40
-
41
-
42
-
43
-
44
-
45
-
46
-
47
-
48
-
49
-
50
-
51
-
52
-
53
-
54
-
55
-
56
-
57
-
58
-
59
-
60
-
61
-
62
-
63
-
64
-
65
-
66
-
67
-
68
-
69
-
70
-
71
-
72
-
73
-
74
-
75
-
76
-
77
-
78
-
79
-
80
-
81
-
82
-
83
-
84
-
85
-
86
-
87
-
88
-
89
-
90
-
91
-
92
-
93
-
94
-
95
-
96
-
97
-
98
-
99
-
100
-
101
-
102
-
103
-
104
-
105
-
106
-
107
-
108
-
109
-
110
-
111
-
112
-
113
-
114
-
115
-
116
-
117
-
118
-
119
-
120
-
121
-
122
-
123
-
124
-
125
-
126
-
127
-
128
-
129
-
130
-
131
-
132
-
133
-
134
-
135
-
136
-
137
-
138
-
139
-
140
-
141
-
142
-
143
-
144
-
145
-
146
-
147
-
148
-
149
-
150
-
151
-
152
-
153
-
154
-
155
-
156
-
157
-
158
-
159
-
160
-
161
-
162
-
163
-
164
-
165
-
166
-
167
-
168
-
169
-
170
-
171
-
172
-
173
-
174
-
175
-
176
-
177
-
178
-
179
-
180
-
181
-
182
-
183
-
184
-
185
-
186
-
187
-
188
-
189
-
190
-
191
-
192
-
193
-
194
-
195
-
196
-
197
-
198
-
199
-
200
-
201
-
202
-
203
-
204
-
205
-
206
-
207
-
208
-
209
-
210
-
211
-
212
-
213
-
214
-
215
-
216
 |
 |

25
plan assets or a calculated value of plan assets. Kodak uses a calculated value that recognizes changes in the fair value of assets
over a four-year period. At December 31, 2008, the calculated value of the assets of the major U.S. defined benefit pension plan (the
Kodak Retirement Income Plan “KRIP”) was approximately $6 billion and the fair value was approximately $5 billion. Asset gains and
losses that are not yet reflected in the calculated value of plan assets are not included in amortization of unrecognized gains and
losses until they are recognized as a part of the calculated value of plan assets.
The Company reviews its EROA assumption annually. To facilitate this review, every three years, or when market conditions change
materially, the Company’s larger plans will undertake asset allocation or asset and liability modeling studies. In early 2008, an asset
and liability modeling study for the KRIP was completed and resulted in a 9.0% EROA assumption, which is the same rate outcome
as concluded by the prior study in 2005. During the fourth quarter of 2008, the Kodak Retirement Income Plan Committee
(“KRIPCO,” the committee that oversees KRIP) reevaluated certain portfolio positions relative to current market conditions and
accordingly approved a change to the portfolio to reduce risk associated with the volatility in the financial markets. The Company has
assumed an 8.0% EROA for 2009 for the KRIP based on these changes and the resulting asset allocation at December 31, 2008. It
is KRIPCO’s intention to reassess the current asset allocation and complete a new asset and liability study in early 2009. Certain of
the Company’s other pension plans also adjusted asset positions during the fourth quarter of 2008. EROA assumptions for 2009 for
those plans were similarly based on these changes and the resulting asset allocations as of the end of the year.
Generally, the Company bases the discount rate assumption for its significant plans on high quality corporate bond yields in the
respective countries as of the measurement date. Specifically, for its U.S. and Canada plans, the Company determines a discount
rate using a cash flow model to incorporate the expected timing of benefit payments and a AA-rated corporate bond yield curve. For
the Company's U.S. plans, the Citigroup Above Median Pension Discount Curve is used. For the Company’s other non-U.S. plans,
the discount rates are determined by comparison to published local high quality bond yields or indices considering estimated plan
duration and removing any outlying bonds, as warranted.
The salary growth assumptions are determined based on the Company’s long-term actual experience and future and near-term
outlook. The healthcare cost trend rate assumptions are based on historical cost and payment data, the near-term outlook and an
assessment of the likely long-term trends.
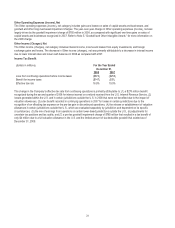
The following table illustrates the sensitivity to a change to certain key assumptions used in the calculation of expense for the year
ending December 31, 2009 and the projected benefit obligation (“PBO”) at December 31, 2008 for the Company's major U.S. and
non-U.S. defined benefit pension plans:
(in millions)
Impact on 2009
Pre-Tax Pension Expense
Increase (Decrease)
Impact on PBO
December 31, 2008
Increase (Decrease)
U.S. Non-U.S.
U.S.
Non-U.S.
Change in assumption:
25 basis point decrease in discount rate $ (2) $ 4
$ 102
$96
25 basis point increase in discount rate 2 (4)
(97)
(91)
25 basis point decrease in EROA 15 7
N/A
N/A
25 basis point increase in EROA (15) (7)
N/A
N/A
Total pension income from continuing operations before special termination benefits, curtailments, and settlements for the major
funded and unfunded defined benefit pension plans in the U.S. is expected to decrease from $179 million in 2008 to $108 million in
2009, due primarily to lower expected returns on plan assets for 2009. Pension expense from continuing operations before special
termination benefits, curtailments and settlements for the major funded and unfunded non-U.S. defined benefit pension plans is
projected to decrease from $27 million in 2008 to $5 million in 2009, which is primarily attributable to lower amortization of actuarial
losses.
Additionally, due to changes in plan design, the Company expects the expense, before curtailment and settlement gains and losses
of its major other postretirement benefit plans to approximate $48 million in 2009 as compared with $104 million for 2008.