Kodak 2008 Annual Report Download - page 39
Download and view the complete annual report
Please find page 39 of the 2008 Kodak annual report below. You can navigate through the pages in the report by either clicking on the pages listed below, or by using the keyword search tool below to find specific information within the annual report.-
 1
1 -
2
-
3
-
4
-
5
-
6
-
7
-
8
-
9
-
10
-
11
-
12
-
13
-
14
-
15
-
16
-
17
-
18
-
19
-
20
-
21
-
22
-
23
-
24
-
25
-
26
-
27
-
28
-
 29
29 -
 30
30 -
 31
31 -
 32
32 -
 33
33 -
 34
34 -
 35
35 -
 36
36 -
 37
37 -
 38
38 -
 39
39 -
 40
40 -
 41
41 -
 42
42 -
 43
43 -
 44
44 -
 45
45 -
 46
46 -
 47
47 -
 48
48 -
 49
49 -
50
-
51
-
52
-
53
-
54
-
55
-
56
-
57
-
58
-
59
-
60
-
61
-
62
-
63
-
64
-
65
-
66
-
67
-
68
-
69
-
70
-
71
-
72
-
73
-
74
-
75
-
76
-
77
-
78
-
79
-
80
-
81
-
82
-
83
-
84
-
85
-
86
-
87
-
88
-
89
-
90
-
91
-
92
-
93
-
94
-
95
-
96
-
97
-
98
-
99
-
100
-
101
-
102
-
103
-
104
-
105
-
106
-
107
-
108
-
109
-
110
-
111
-
112
-
113
-
114
-
115
-
116
-
117
-
118
-
119
-
120
-
121
-
122
-
123
-
124
-
125
-
126
-
127
-
128
-
129
-
130
-
131
-
132
-
133
-
134
-
135
-
136
-
137
-
138
-
139
-
140
-
141
-
142
-
143
-
144
-
145
-
146
-
147
-
148
-
149
-
150
-
151
-
152
-
153
-
154
-
155
-
156
-
157
-
158
-
159
-
160
-
161
-
162
-
163
-
164
-
165
-
166
-
167
-
168
-
169
-
170
-
171
-
172
-
173
-
174
-
175
-
176
-
177
-
178
-
179
-
180
-
181
-
182
-
183
-
184
-
185
-
186
-
187
-
188
-
189
-
190
-
191
-
192
-
193
-
194
-
195
-
196
-
197
-
198
-
199
-
200
-
201
-
202
-
203
-
204
-
205
-
206
-
207
-
208
-
209
-
210
-
211
-
212
-
213
-
214
-
215
-
216
 |
 |

37
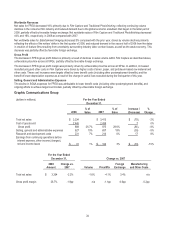
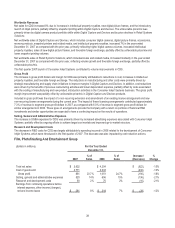
Worldwide Revenues
For the year ended December 31, 2007, net sales decreased by 3% compared with 2006, primarily as a result of unfavorable
price/mix across all segments and significant industry-related volume declines, driven largely by Film Capture and Traditional
Photofinishing within FPEG. These declines were partially offset by significant volume growth in Digital Capture within CDG, volume
growth within GCG, favorable foreign exchange across all segments, and increases in intellectual property royalties.
Gross Profit
Gross profit improved in the year ended December 31, 2007 in both dollars and as a percentage of sales, due largely to reduced
manufacturing and other costs as a result of a number of factors, as well as increased intellectual property royalties within CDG. In
addition, foreign exchange was a positive contributor to gross profit as a result of the weak U.S. dollar’s net impact on revenues and
costs. The decreases in manufacturing and other costs were due to a combination of the impact of the Company's cost reduction
initiatives, strategic manufacturing and supply chain initiatives within CDG, lower restructuring-related charges, and lower
depreciation expense, partially offset by increased silver and aluminum costs. The unfavorable price/mix was driven by product
portfolio shifts in Digital Capture and Devices within CDG, and across the businesses within FPEG.
Included in gross profit for 2007 were a non-recurring extension and amendment of an existing license arrangement and new non-
recurring license arrangements. The impact of these licensing arrangements contributed approximately 2.3% of revenue to
consolidated gross profit dollars in 2007, as compared with 1.7% of revenue to consolidated gross profit dollars for similar
arrangements in 2006. These types of arrangements provide the Company with a return on portions of historical R&D investments
and similar opportunities are expected to have a continuing impact on the results of operations.
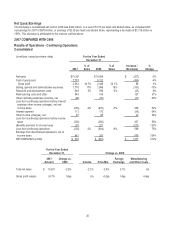
Selling, General and Administrative Expenses
The year-over-year decrease in consolidated SG&A in dollars and as a percent of sales was primarily attributable to significant
Company-wide cost reduction actions, partially offset by increased advertising costs related to Consumer Inkjet Systems and the
impacts of foreign exchange.
Research and Development Costs
The decrease in R&D costs was primarily driven by the continuing realignment of resources, as well as the timing of development of
new products.
Restructuring Costs, Rationalization and Other
The most significant charge within restructuring costs was a $238 million impairment charge related to the sale of the Company's
Xiamen, China facility in the second quarter. These costs, as well as the restructuring-related costs reported in cost of goods sold,
are discussed in further detail under the "Restructuring Costs, Rationalization And Other" section.
Other Operating (Income) Expenses, Net
The Other operating (income) expenses, net category includes gains and losses on sales of capital assets and certain asset
impairment charges. The year-over-year increase in Other operating (income) expenses, net was largely driven by gains on sales of
capital assets and businesses in 2007 of $158 million, partially offset by asset impairments including the impairment of an intangible
asset of $46 million in connection with the Company’s plan to dispose of its stake in Lucky Film Co. Ltd.
Interest Expense
Lower Interest expense was primarily due to lower debt levels resulting from the full payoff of the Company's Secured Term Debt in
the second quarter of 2007, partially offset by higher interest rates in 2007 as compared with 2006.
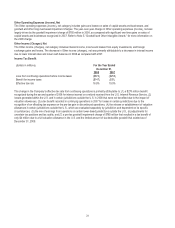
Other Income (Charges), Net
The Other income (charges), net category includes interest income, income and losses from equity investments, and foreign
exchange gains and losses. The increase in Other income (charges), net in 2007 as compared with 2006 was primarily attributable
to increased interest income due to higher cash balances resulting from the proceeds on the sale of the Health Group (See Note 22,
“Discontinued Operations” in the Notes to Financial Statements) and higher interest rates. This increase was partially offset by an
impairment of an equity method investment.
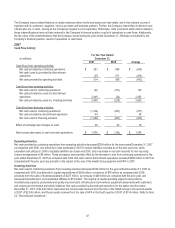
Income Tax (Benefit) Provision
(dollars in millions) For the Year Ended
December 31,
2007 2006
Loss from continuing operations before income taxes ($256) ($583)
(Benefit) provision for income taxes ($51) $221
Effective tax rate 19.9% (37.9)%