Kodak 2008 Annual Report Download - page 170
Download and view the complete annual report
Please find page 170 of the 2008 Kodak annual report below. You can navigate through the pages in the report by either clicking on the pages listed below, or by using the keyword search tool below to find specific information within the annual report.-
 1
1 -
2
-
3
-
4
-
5
-
6
-
7
-
8
-
9
-
10
-
11
-
12
-
13
-
14
-
15
-
16
-
17
-
18
-
19
-
20
-
21
-
22
-
23
-
24
-
25
-
26
-
27
-
28
-
29
-
30
-
31
-
32
-
33
-
34
-
35
-
36
-
37
-
38
-
39
-
40
-
41
-
42
-
43
-
44
-
45
-
46
-
47
-
48
-
49
-
50
-
51
-
52
-
53
-
54
-
55
-
56
-
57
-
58
-
59
-
60
-
61
-
62
-
63
-
64
-
65
-
66
-
67
-
68
-
69
-
70
-
71
-
72
-
73
-
74
-
75
-
76
-
77
-
78
-
79
-
80
-
81
-
82
-
83
-
84
-
85
-
86
-
87
-
88
-
89
-
90
-
91
-
92
-
93
-
94
-
95
-
96
-
97
-
98
-
99
-
100
-
101
-
102
-
103
-
104
-
105
-
106
-
107
-
108
-
109
-
110
-
111
-
112
-
113
-
114
-
115
-
116
-
117
-
118
-
119
-
120
-
121
-
122
-
123
-
124
-
125
-
126
-
127
-
128
-
129
-
130
-
131
-
132
-
133
-
134
-
135
-
136
-
137
-
138
-
139
-
140
-
141
-
142
-
143
-
144
-
145
-
146
-
147
-
148
-
149
-
150
-
151
-
152
-
153
-
154
-
155
-
156
-
157
-
158
-
159
-
 160
160 -
 161
161 -
 162
162 -
 163
163 -
 164
164 -
 165
165 -
 166
166 -
 167
167 -
 168
168 -
 169
169 -
 170
170 -
 171
171 -
 172
172 -
 173
173 -
 174
174 -
 175
175 -
 176
176 -
 177
177 -
 178
178 -
 179
179 -
 180
180 -
181
-
182
-
183
-
184
-
185
-
186
-
187
-
188
-
189
-
190
-
191
-
192
-
193
-
194
-
195
-
196
-
197
-
198
-
199
-
200
-
201
-
202
-
203
-
204
-
205
-
206
-
207
-
208
-
209
-
210
-
211
-
212
-
213
-
214
-
215
-
216
 |
 |

44
Committee Decision and Analysis
The Committee established the threshold, target and maximum award levels as follows: 1) the threshold was established at $200M; 2) the
target was established at the low-end of the external guidance range; and 3) the maximum was set at the top end of the external guidance
range. These levels were established to align with external guidance, while also providing the Company flexibility to make additional
investment during the fiscal year to grow the Company’s digital businesses.
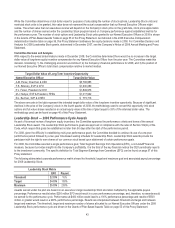
2008 Leadership Stock Program Results
For 2008, the Company’s EFO was $33 million. Since this result was below the threshold EFO of $200 million, the Leadership Stock Matrix
delivered a zero performance percentage.
Committee Decision and Analysis
Based on the Company results, the Committee certified a zero performance award for Leadership Stock. As a result, our Named Executive
Officers did not receive a Leadership Stock award for the 2008 performance cycle.
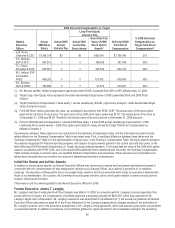
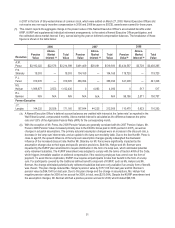
2008 Delivered Compensation
Largely due to the Company’s results in 2008, the delivered compensation for our Named Executive Officers in 2008 was significantly
below the target total direct compensation levels that the Committee established. By “delivered compensation,” we mean the compensation
that was actually delivered to our Named Executive Officers for 2008 (i.e., delivered compensation = 2008 base salary + the actual 2008
annual variable pay (EXCEL) award earned + the actual 2008 Leadership Stock award earned + the SFAS 123R grant date fair value of
the stock options granted in 2008). The following tables demonstrate that the delivered compensation for our Named Executive Officers
was 21% to 34% of their target total direct compensation in 2008. This outcome resulted from a zero payout under the EXCEL and
Leadership Stock plans and the manner in which dollar-denominated long-term equity targets were converted into actual awards (as
described on page 46 of this Proxy Statement) and valued based on the grant date fair value.
The grant date fair value of stock options will be realized only in the event of stock price appreciation. As indicated in footnote 4 below, as
of December 31, 2008, the intrinsic value of the stock options was zero. If the stock option value in the tables reflected the intrinsic stock
option value, rather than the SFAS 123R grant date fair value, as of December 31, 2008, delivered compensation of our Named Executive
Officers as a percentage of their target total direct compensation would range from 13% to 27%.
These tables demonstrate the degree of performance sensitivity inherent in our overall compensation programs and how the various
incentive plans operate to ensure that compensation realized by Named Executive Officers is aligned with overall Company results and
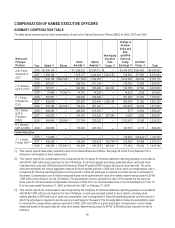
changes in shareholder value. The information on these tables differs substantially from the Summary Compensation Table on page 49 of
this Proxy Statement and is not a substitute for that table. A description of those differences is found following these tables.
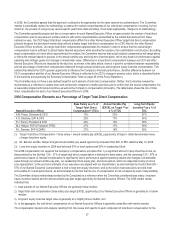
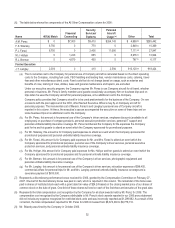
2008 Target Compensation
Target Long-Term Equity Value(2)
Named
Executive Officer Base Salary
Target Annual
Variable Pay(1)
2008 Leadership
Stock
2008 Stock
Options
Target Total Direct
Compensation(3)
A.M. Perez,
Chairman & CEO $1,100,000 $1,705,000 $2,893,443 $2,893,443 $8,591,886
F.S. Sklarsky,
EVP&CFO 600,000 450,000 800,040 800,040 2,650,080
P.J. Faraci,
President & COO 700,000 595,000 949,989 949,989 3,194,978
M.J. Hellyar,
EVP & President,
FPEG 490,000 313,600 508,981 508,981 1,821,562
R.L. Berman, SVP
& CHRO 385,000 246,400 387,858 387,858 1,407,116