Kodak 2008 Annual Report Download - page 37
Download and view the complete annual report
Please find page 37 of the 2008 Kodak annual report below. You can navigate through the pages in the report by either clicking on the pages listed below, or by using the keyword search tool below to find specific information within the annual report.-
 1
1 -
2
-
3
-
4
-
5
-
6
-
7
-
8
-
9
-
10
-
11
-
12
-
13
-
14
-
15
-
16
-
17
-
18
-
19
-
20
-
21
-
22
-
23
-
24
-
25
-
26
-
 27
27 -
 28
28 -
 29
29 -
 30
30 -
 31
31 -
 32
32 -
 33
33 -
 34
34 -
 35
35 -
 36
36 -
 37
37 -
 38
38 -
 39
39 -
 40
40 -
 41
41 -
 42
42 -
 43
43 -
 44
44 -
 45
45 -
 46
46 -
 47
47 -
48
-
49
-
50
-
51
-
52
-
53
-
54
-
55
-
56
-
57
-
58
-
59
-
60
-
61
-
62
-
63
-
64
-
65
-
66
-
67
-
68
-
69
-
70
-
71
-
72
-
73
-
74
-
75
-
76
-
77
-
78
-
79
-
80
-
81
-
82
-
83
-
84
-
85
-
86
-
87
-
88
-
89
-
90
-
91
-
92
-
93
-
94
-
95
-
96
-
97
-
98
-
99
-
100
-
101
-
102
-
103
-
104
-
105
-
106
-
107
-
108
-
109
-
110
-
111
-
112
-
113
-
114
-
115
-
116
-
117
-
118
-
119
-
120
-
121
-
122
-
123
-
124
-
125
-
126
-
127
-
128
-
129
-
130
-
131
-
132
-
133
-
134
-
135
-
136
-
137
-
138
-
139
-
140
-
141
-
142
-
143
-
144
-
145
-
146
-
147
-
148
-
149
-
150
-
151
-
152
-
153
-
154
-
155
-
156
-
157
-
158
-
159
-
160
-
161
-
162
-
163
-
164
-
165
-
166
-
167
-
168
-
169
-
170
-
171
-
172
-
173
-
174
-
175
-
176
-
177
-
178
-
179
-
180
-
181
-
182
-
183
-
184
-
185
-
186
-
187
-
188
-
189
-
190
-
191
-
192
-
193
-
194
-
195
-
196
-
197
-
198
-
199
-
200
-
201
-
202
-
203
-
204
-
205
-
206
-
207
-
208
-
209
-
210
-
211
-
212
-
213
-
214
-
215
-
216
 |
 |
35
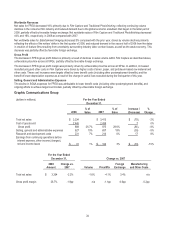
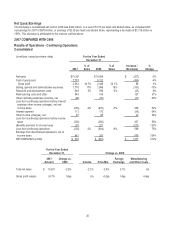
Worldwide Revenues
GCG net sales decreased 2% as compared with the prior year, driven by unfavorable price/mix and volume declines, partially offset
by favorable foreign exchange. Recent global financial market disruptions affected equipment placements across most product lines,
and tightening credit availability resulted in deferrals of some orders taken earlier this year at the drupa tradeshow. In addition, the
decline in global print demand translated into decreased sales of consumables, especially in the second half of 2008.
Net worldwide sales of Prepress Solutions decreased 2% compared with 2007, driven primarily by volume declines in analog plates
and output devices, partially offset by volume growth in digital plates and favorable foreign exchange. The decline in global print
demand accelerated the volume decline for analog plates and negatively impacted the volume growth rate for digital plates. Despite
the effects of the economic downturn, digital plates experienced volume growth in the high single digits during 2008.
Net worldwide sales of Digital Printing Solutions decreased 6% compared with the prior year. Unfavorable price/mix and declines in
volume were partially offset by favorable foreign exchange for all products. Volume declines were largely attributable to black-and-
white electrophotographic equipment and consumables due to overall market declines, as certain customers convert to solutions that
offer color options. Color electrophotographic equipment and consumables volumes increased, driven by new product line
introductions and enhancements. Page volume growth of 12% in the color electrophotographic space was a key contributor to the
growth of color consumable sales volumes. Unfavorable inkjet equipment volume and price/mix were partially offset by favorable
volume and price/mix in inkjet consumables. General price erosion, declines in legacy product sales, and a mix shift toward units
requiring lower levels of capital investment were contributors to this performance.
Net worldwide sales of Document Imaging decreased 2% compared with the prior year. Unfavorable price/mix was partially offset by
volume growth and favorable foreign exchange. While volume grew in both the Production Scanner and Distributed Scanner
categories, a shift toward low-page volume units in both categories drove unfavorable price/mix.
Net worldwide sales of Enterprise Solutions decreased 1% as compared with the prior year. Unfavorable price/mix and volume
declines were partially offset by favorable foreign exchange and acquisitions made during the second quarter of 2008.
Gross Profit
The decline in gross profit dollars and margin was primarily driven by Prepress Solutions and Digital Printing Solutions. Increased
manufacturing costs related to aluminum and petroleum-based raw materials, as well as higher distribution expense and volume
declines, drove the decrease in the Prepress Solutions gross profit dollars and margin. For Digital Printing Solutions, higher costs of
newly introduced digital printers, price erosion and adverse mix were partially offset by manufacturing cost productivity.
Selling, General and Administrative Expenses
The decrease in SG&A expenses for GCG primarily reflects lower benefit costs (including other postemployment benefits) and
ongoing efforts to achieve target cost models, partially offset by increased costs associated with the Company’s participation in the
drupa tradeshow in the second quarter of 2008, go-to-market investments, and unfavorable foreign exchange.
Research and Development Costs
The increase in R&D costs for GCG was primarily driven by investments in new workflow products in Enterprise Solutions, R&D
related to acquisitions made in the second quarter of 2008, increased investments for stream technology within Digital Printing
Solutions, and unfavorable foreign exchange. These increases were partially offset by ongoing efforts to achieve target cost models.
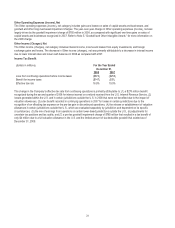
Results of Operations – Discontinued Operations
Total Company earnings from discontinued operations for the year ended December 31, 2008 and 2007 of $285 million and $881
million, respectively, include a benefit for income taxes of $288 million and a provision for income taxes of $262 million, respectively.
Earnings from discontinued operations in 2008 were primarily driven by a tax refund that the Company received from the U.S.
Internal Revenue Service. The refund was related to the audit of certain claims filed for tax years 1993-1998. A portion of the refund
related to past federal income taxes paid in relation to the 1994 sale of a subsidiary, Sterling Winthrop Inc., which was reported in
discontinued operations. Refer to Note 15, “Income Taxes,” for further discussion of the tax refund.
Earnings from discontinued operations in 2007 were primarily driven by the $986 million pre-tax gain on the sale of the Health Group
segment on April 30, 2007, and the $123 million pre-tax gain on the sale of Hermes Precisa Pty. Ltd. (“HPA”) on November 2, 2007.
Also included in discontinued operations in 2007 are the results of operations of the Health Group segment and HPA through their
respective dates of sale.
For a detailed discussion of the components of discontinued operations, refer to Note 22, “Discontinued Operations,” in the Notes to
Financial Statements.