Kodak 2008 Annual Report Download - page 23
Download and view the complete annual report
Please find page 23 of the 2008 Kodak annual report below. You can navigate through the pages in the report by either clicking on the pages listed below, or by using the keyword search tool below to find specific information within the annual report.-
 1
1 -
2
-
3
-
4
-
5
-
6
-
7
-
8
-
9
-
10
-
11
-
12
-
 13
13 -
 14
14 -
 15
15 -
 16
16 -
 17
17 -
 18
18 -
 19
19 -
 20
20 -
 21
21 -
 22
22 -
 23
23 -
 24
24 -
 25
25 -
 26
26 -
 27
27 -
 28
28 -
 29
29 -
 30
30 -
 31
31 -
 32
32 -
 33
33 -
34
-
35
-
36
-
37
-
38
-
39
-
40
-
41
-
42
-
43
-
44
-
45
-
46
-
47
-
48
-
49
-
50
-
51
-
52
-
53
-
54
-
55
-
56
-
57
-
58
-
59
-
60
-
61
-
62
-
63
-
64
-
65
-
66
-
67
-
68
-
69
-
70
-
71
-
72
-
73
-
74
-
75
-
76
-
77
-
78
-
79
-
80
-
81
-
82
-
83
-
84
-
85
-
86
-
87
-
88
-
89
-
90
-
91
-
92
-
93
-
94
-
95
-
96
-
97
-
98
-
99
-
100
-
101
-
102
-
103
-
104
-
105
-
106
-
107
-
108
-
109
-
110
-
111
-
112
-
113
-
114
-
115
-
116
-
117
-
118
-
119
-
120
-
121
-
122
-
123
-
124
-
125
-
126
-
127
-
128
-
129
-
130
-
131
-
132
-
133
-
134
-
135
-
136
-
137
-
138
-
139
-
140
-
141
-
142
-
143
-
144
-
145
-
146
-
147
-
148
-
149
-
150
-
151
-
152
-
153
-
154
-
155
-
156
-
157
-
158
-
159
-
160
-
161
-
162
-
163
-
164
-
165
-
166
-
167
-
168
-
169
-
170
-
171
-
172
-
173
-
174
-
175
-
176
-
177
-
178
-
179
-
180
-
181
-
182
-
183
-
184
-
185
-
186
-
187
-
188
-
189
-
190
-
191
-
192
-
193
-
194
-
195
-
196
-
197
-
198
-
199
-
200
-
201
-
202
-
203
-
204
-
205
-
206
-
207
-
208
-
209
-
210
-
211
-
212
-
213
-
214
-
215
-
216
 |
 |
21
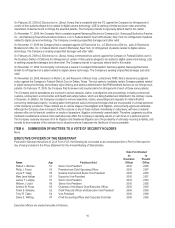
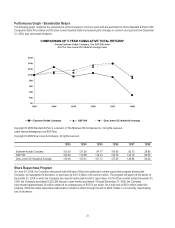
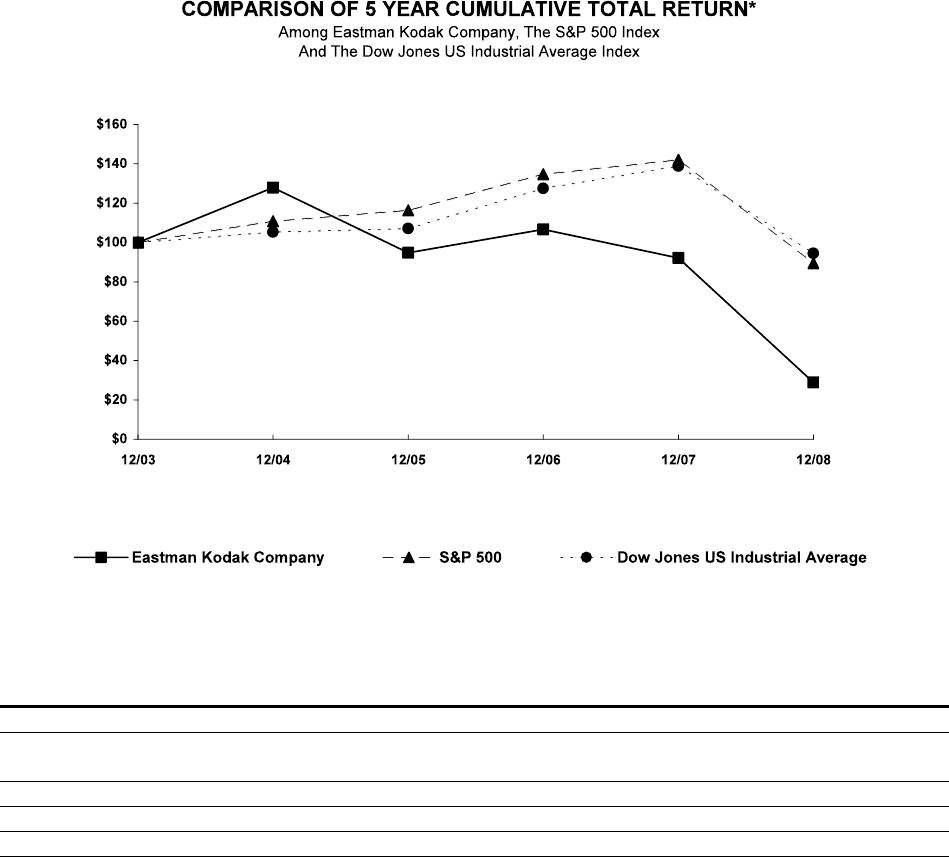
Performance Graph - Shareholder Return
The following graph compares the performance of the Company's common stock with the performance of the Standard & Poor's 500
Composite Stock Price Index and the Dow Jones Industrial Index by measuring the changes in common stock prices from December
31, 2003, plus reinvested dividends.
Copyright © 2009 Standard & Poor's, a division of The McGraw-Hill Companies Inc. All rights reserved.
(www.researchdatagroup.com/S&P.htm)
Copyright © 2009 Dow Jones & Company. All rights reserved.
12/03 12/04 12/05 12/06 12/07 12/08
Eastman Kodak Company 100.00 127.90 94.77 106.69 92.13 28.86
S&P 500 100.00 110.88 116.33 134.70 142.10 89.53
Dow Jones US Industrial Average 100.00 105.31 107.13 127.53 138.86 94.52
Share Repurchase Program
On June 24, 2008, the Company announced that its Board of Directors authorized a share repurchase program allowing the
Company, at management’s discretion, to purchase up to $1.0 billion of its common stock. The program will expire at the earlier of
December 31, 2009 or when the Company has used all authorized funds for repurchase. For the three months ended December 31,
2008, the Company purchased 5,933,396 shares in open market purchases. Through December 31, 2008, the Company
repurchased approximately 20 million shares at an average price of $15.01 per share, for a total cost of $301 million under this
program. While the share repurchase authorization remains in effect through the end of 2009, Kodak is not currently repurchasing
any of its shares.