Kodak 2008 Annual Report Download - page 42
Download and view the complete annual report
Please find page 42 of the 2008 Kodak annual report below. You can navigate through the pages in the report by either clicking on the pages listed below, or by using the keyword search tool below to find specific information within the annual report.-
 1
1 -
2
-
3
-
4
-
5
-
6
-
7
-
8
-
9
-
10
-
11
-
12
-
13
-
14
-
15
-
16
-
17
-
18
-
19
-
20
-
21
-
22
-
23
-
24
-
25
-
26
-
27
-
28
-
29
-
30
-
31
-
 32
32 -
 33
33 -
 34
34 -
 35
35 -
 36
36 -
 37
37 -
 38
38 -
 39
39 -
 40
40 -
 41
41 -
 42
42 -
 43
43 -
 44
44 -
 45
45 -
 46
46 -
 47
47 -
 48
48 -
 49
49 -
 50
50 -
 51
51 -
 52
52 -
53
-
54
-
55
-
56
-
57
-
58
-
59
-
60
-
61
-
62
-
63
-
64
-
65
-
66
-
67
-
68
-
69
-
70
-
71
-
72
-
73
-
74
-
75
-
76
-
77
-
78
-
79
-
80
-
81
-
82
-
83
-
84
-
85
-
86
-
87
-
88
-
89
-
90
-
91
-
92
-
93
-
94
-
95
-
96
-
97
-
98
-
99
-
100
-
101
-
102
-
103
-
104
-
105
-
106
-
107
-
108
-
109
-
110
-
111
-
112
-
113
-
114
-
115
-
116
-
117
-
118
-
119
-
120
-
121
-
122
-
123
-
124
-
125
-
126
-
127
-
128
-
129
-
130
-
131
-
132
-
133
-
134
-
135
-
136
-
137
-
138
-
139
-
140
-
141
-
142
-
143
-
144
-
145
-
146
-
147
-
148
-
149
-
150
-
151
-
152
-
153
-
154
-
155
-
156
-
157
-
158
-
159
-
160
-
161
-
162
-
163
-
164
-
165
-
166
-
167
-
168
-
169
-
170
-
171
-
172
-
173
-
174
-
175
-
176
-
177
-
178
-
179
-
180
-
181
-
182
-
183
-
184
-
185
-
186
-
187
-
188
-
189
-
190
-
191
-
192
-
193
-
194
-
195
-
196
-
197
-
198
-
199
-
200
-
201
-
202
-
203
-
204
-
205
-
206
-
207
-
208
-
209
-
210
-
211
-
212
-
213
-
214
-
215
-
216
 |
 |

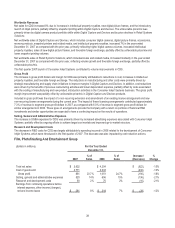
40
For the Year Ended
December 31, Change vs. 2006
2007
Amount
Change vs.
2006 Volume Price/Mix
Foreign
Exchange
Manufacturing
and Other Costs
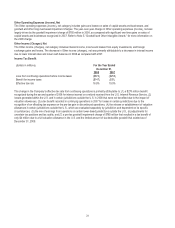
Total net sales $ 3,632 -14.6% -15.1% -2.1% 2.6% n/a
Gross profit margin 23.7% -1.0pp n/a -3.0pp 1.6pp 0.4pp
Worldwide Revenues
Net sales for FPEG decreased 15% primarily due to Film Capture and Traditional Photofinishing, primarily reflecting continuing
declines in the consumer film industry, partially offset by favorable foreign exchange. Net worldwide sales of Film Capture and
Traditional Photofinishing decreased 30% and 19%, respectively, in the year ended December 31, 2007 as compared with 2006. Net
worldwide sales for Entertainment Imaging were flat as compared with 2006.
Gross Profit
The decrease in FPEG gross profit dollars was primarily a result of lower volumes in Film Capture, unfavorable price/mix associated
with new and renewed film agreements, partially offset by favorable foreign exchange and reduced manufacturing and other costs.
The reduced manufacturing and other costs were driven by the manufacturing footprint reduction and other cost reduction initiatives,
partially offset by higher silver costs. FPEG gross profit margin decreased only 1%.
Selling, General and Administrative Expenses
The decline in SG&A expenses for FPEG in dollars and as a percent of sales was attributable to ongoing efforts to achieve target
cost models and shifting to a distributor model in regions with lower sales volumes.
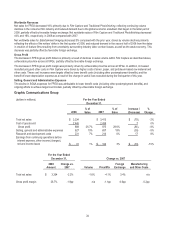
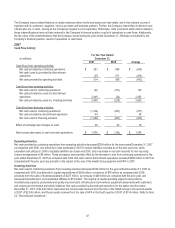
Graphic Communications Group
(dollars in millions) For the Year Ended
December 31,
2007
%of
Sales 2006
%of
Sales
Increase /
(Decrease)
%
Change
Total net sales $3,413 $ 3,287 $ 126 4%
Cost of goods sold 2,438 2,261 177 8%
Gross profit 975 28.6% 1,026
31.2%
(51) -5%
Selling, general and administrative expenses 657 19% 747
23%
(90) -12%
Research and development costs 214 6% 209
6%
52%
Earnings from continuing operations before
interest expense, other income (charges),
net and income taxes $ 104 3% $ 70
2%
$34 49%
For the Year Ended
December 31, Change vs. 2006
2007
Amount
Change
vs. 2006 Volume Price/Mix
Foreign
Exchange
Manufacturing
and Other Costs Acquisition
Total net sales $ 3,413 3.8% 1.5% -1.8% 4.1% n/a 22.6%
Gross profit margin 28.6% -2.6pp n/a -1.7pp 0.7pp -1.6pp 0.5pp