Kodak 2008 Annual Report Download - page 43
Download and view the complete annual report
Please find page 43 of the 2008 Kodak annual report below. You can navigate through the pages in the report by either clicking on the pages listed below, or by using the keyword search tool below to find specific information within the annual report.-
 1
1 -
2
-
3
-
4
-
5
-
6
-
7
-
8
-
9
-
10
-
11
-
12
-
13
-
14
-
15
-
16
-
17
-
18
-
19
-
20
-
21
-
22
-
23
-
24
-
25
-
26
-
27
-
28
-
29
-
30
-
31
-
32
-
 33
33 -
 34
34 -
 35
35 -
 36
36 -
 37
37 -
 38
38 -
 39
39 -
 40
40 -
 41
41 -
 42
42 -
 43
43 -
 44
44 -
 45
45 -
 46
46 -
 47
47 -
 48
48 -
 49
49 -
 50
50 -
 51
51 -
 52
52 -
 53
53 -
54
-
55
-
56
-
57
-
58
-
59
-
60
-
61
-
62
-
63
-
64
-
65
-
66
-
67
-
68
-
69
-
70
-
71
-
72
-
73
-
74
-
75
-
76
-
77
-
78
-
79
-
80
-
81
-
82
-
83
-
84
-
85
-
86
-
87
-
88
-
89
-
90
-
91
-
92
-
93
-
94
-
95
-
96
-
97
-
98
-
99
-
100
-
101
-
102
-
103
-
104
-
105
-
106
-
107
-
108
-
109
-
110
-
111
-
112
-
113
-
114
-
115
-
116
-
117
-
118
-
119
-
120
-
121
-
122
-
123
-
124
-
125
-
126
-
127
-
128
-
129
-
130
-
131
-
132
-
133
-
134
-
135
-
136
-
137
-
138
-
139
-
140
-
141
-
142
-
143
-
144
-
145
-
146
-
147
-
148
-
149
-
150
-
151
-
152
-
153
-
154
-
155
-
156
-
157
-
158
-
159
-
160
-
161
-
162
-
163
-
164
-
165
-
166
-
167
-
168
-
169
-
170
-
171
-
172
-
173
-
174
-
175
-
176
-
177
-
178
-
179
-
180
-
181
-
182
-
183
-
184
-
185
-
186
-
187
-
188
-
189
-
190
-
191
-
192
-
193
-
194
-
195
-
196
-
197
-
198
-
199
-
200
-
201
-
202
-
203
-
204
-
205
-
206
-
207
-
208
-
209
-
210
-
211
-
212
-
213
-
214
-
215
-
216
 |
 |
41
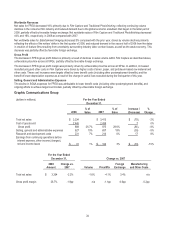
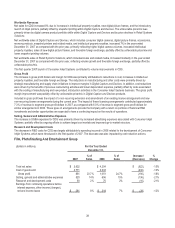
Worldwide Revenues
Total revenue growth of 4% for GCG was driven by favorable foreign exchange and volume increases within Digital Printing
Solutions and Enterprise Solutions. Partially offsetting this growth was unfavorable price/mix across all SPGs.
Net worldwide sales of Prepress Solutions increased 3%, primarily driven by increased sales of digital plates and favorable foreign
exchange, partially offset by declines in sales of analog plates and output devices. Unfavorable price/mix also negatively impacted
net worldwide sales.
Net worldwide sales of Digital Printing Solutions increased 5%, primarily driven by favorable foreign exchange and volume growth in
color electrophotographic solutions and inkjet printing solutions, partially offset by volume and price/mix declines in black-and-white
electrophotographic solutions.
Net worldwide sales of Document Imaging were flat in 2007 compared with the prior year. Unfavorable volume and price/mix were
offset by favorable foreign exchange.
Net worldwide sales of Enterprise Solutions increased 10%, primarily driven by the introduction of web-enabled solutions software,
volume growth in the workflow software and favorable foreign exchange, partially offset by unfavorable price/mix.
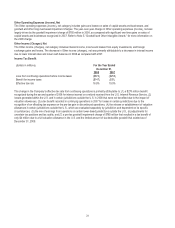
Gross Profit
The decrease in gross profit margin in 2007 compared with the prior year was primarily driven by increased manufacturing costs in
Prepress Solutions associated with adverse aluminum costs, as well as unfavorable price/mix across all SPGs. Favorable foreign
exchange partially offset these negative impacts.
Selling, General and Administrative Expenses
The decrease in SG&A expenses for GCG was largely attributable to ongoing efforts to achieve target cost models.
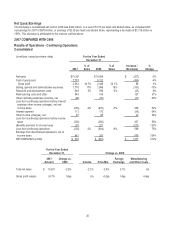
Results of Operations – Discontinued Operations
Total Company earnings from discontinued operations for the year ended December 31, 2007 and 2006 of $881 million and $203
million, respectively, were net of provisions for income taxes of $262 million and $34 million, respectively.
Earnings from discontinued operations in 2007 were primarily driven by the $986 million pre-tax gain on the sale of the Health Group
segment on April 30, 2007, and the $123 million pre-tax gain on the sale of Hermes Precisa Pty. Ltd. (“HPA”) on November 2, 2007.
Also included in discontinued operations in 2007 are the results of operations of the Health Group segment and HPA through their
respective dates of sale.
Earnings from discontinued operations in 2006 were primarily driven by results of operations of the Health Group segment.
For a detailed discussion of the components of discontinued operations, refer to Note 22, “Discontinued Operations,” in the Notes to
Financial Statements.
Net Earnings (Loss)
Consolidated net earnings for 2007 were $676 million, or earnings of $2.35 per basic and diluted share, as compared with a net loss
for 2006 of $601 million, or a loss of $2.09 per basic and diluted share, representing an increase in earnings of $1,277 million or
212%. This improvement is attributable to the reasons outlined above.
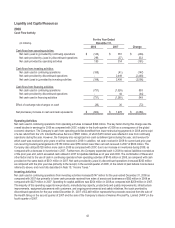
Restructuring Costs, Rationalization and Other
The Company recognizes the need to continually rationalize its workforce and streamline its operations to remain competitive in the
face of an ever-changing business and economic climate. For 2008, these initiatives were referred to as ongoing rationalization
activities.
The Company recorded $149 million of charges, net of reversals, including $6 million of charges for accelerated depreciation and $3
million of charges for inventory write-downs, which were reported in Cost of goods sold in the accompanying Consolidated
Statement of Operations for the year ended December 31, 2008. The remaining costs incurred, net of reversals, of $140 million were
reported as Restructuring costs, rationalization and other in the accompanying Consolidated Statement of Operations for the year
ended December 31, 2008. The severance and exit costs reserves require the outlay of cash, while long-lived asset impairments,
accelerated depreciation and inventory write-downs represent non-cash items.
During the year ended December 31, 2008, the Company made cash payments of approximately $143 million, related to
restructuring and rationalization. Of this amount, $133 million was paid out of restructuring liabilities, while $10 million was paid out of
pension and other postretirement liabilities.