Kodak 2008 Annual Report Download - page 38
Download and view the complete annual report
Please find page 38 of the 2008 Kodak annual report below. You can navigate through the pages in the report by either clicking on the pages listed below, or by using the keyword search tool below to find specific information within the annual report.-
 1
1 -
2
-
3
-
4
-
5
-
6
-
7
-
8
-
9
-
10
-
11
-
12
-
13
-
14
-
15
-
16
-
17
-
18
-
19
-
20
-
21
-
22
-
23
-
24
-
25
-
26
-
27
-
 28
28 -
 29
29 -
 30
30 -
 31
31 -
 32
32 -
 33
33 -
 34
34 -
 35
35 -
 36
36 -
 37
37 -
 38
38 -
 39
39 -
 40
40 -
 41
41 -
 42
42 -
 43
43 -
 44
44 -
 45
45 -
 46
46 -
 47
47 -
 48
48 -
49
-
50
-
51
-
52
-
53
-
54
-
55
-
56
-
57
-
58
-
59
-
60
-
61
-
62
-
63
-
64
-
65
-
66
-
67
-
68
-
69
-
70
-
71
-
72
-
73
-
74
-
75
-
76
-
77
-
78
-
79
-
80
-
81
-
82
-
83
-
84
-
85
-
86
-
87
-
88
-
89
-
90
-
91
-
92
-
93
-
94
-
95
-
96
-
97
-
98
-
99
-
100
-
101
-
102
-
103
-
104
-
105
-
106
-
107
-
108
-
109
-
110
-
111
-
112
-
113
-
114
-
115
-
116
-
117
-
118
-
119
-
120
-
121
-
122
-
123
-
124
-
125
-
126
-
127
-
128
-
129
-
130
-
131
-
132
-
133
-
134
-
135
-
136
-
137
-
138
-
139
-
140
-
141
-
142
-
143
-
144
-
145
-
146
-
147
-
148
-
149
-
150
-
151
-
152
-
153
-
154
-
155
-
156
-
157
-
158
-
159
-
160
-
161
-
162
-
163
-
164
-
165
-
166
-
167
-
168
-
169
-
170
-
171
-
172
-
173
-
174
-
175
-
176
-
177
-
178
-
179
-
180
-
181
-
182
-
183
-
184
-
185
-
186
-
187
-
188
-
189
-
190
-
191
-
192
-
193
-
194
-
195
-
196
-
197
-
198
-
199
-
200
-
201
-
202
-
203
-
204
-
205
-
206
-
207
-
208
-
209
-
210
-
211
-
212
-
213
-
214
-
215
-
216
 |
 |

36
Net (Loss) Earnings
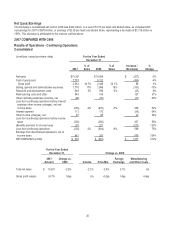
The Company’s consolidated net loss for 2008 was $442 million, or a loss of $1.57 per basic and diluted share, as compared with
net earnings for 2007 of $676 million, or earnings of $2.35 per basic and diluted share, representing a decrease of $1,118 million or
165%. This decrease is attributable to the reasons outlined above.
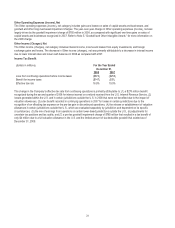
2007 COMPARED WITH 2006
Results of Operations - Continuing Operations
Consolidated
(in millions, except per share data) For the Year Ended
December 31,
2007
%of
Sales 2006
%of
Sales
Increase /
(Decrease)
%
Change
Net sales $10,301 $10,568 $ (267) -3%
Cost of goods sold 7,757 8,122 (365)-4%
Gross profit 2,544 24.7% 2,446
23.1%
98 4%
Selling, general and administrative expenses 1,778 17% 1,969
19%
(191) -10%
Research and development costs 549 5% 596
6%
(47) -8%
Restructuring costs and other 543 416 127 31%
Other operating expenses (income), net (96)(59)(37) 63%
Loss from continuing operations before interest
expense, other income (charges), net and
income taxes (230) -2% (476)
-5%
246 52%
Interest expense 113 172 (59) -34%
Other income (charges), net 87 65 22 34%
Loss from continuing operations before income
taxes (256) (583) 327 56%
(Benefit) provision for income taxes (51) 221 (272) 123%
Loss from continuing operations (205) -2% (804)
-8%
599 75%
Earnings from discontinued operations, net of
income taxes 881 203 678 334%
NET EARNINGS (LOSS) $ 676 $ (601) $ 1,277 212%
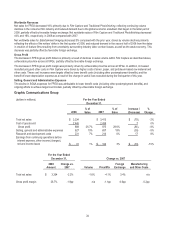
For the Year Ended
December 31, Change vs. 2006
2007
Amount
Change vs.
2006 Volume
Price/Mix
Foreign
Exchange
Manufacturing
and Other Costs
Total net sales $ 10,301 -2.5% -2.2%
-3.4%
3.1% n/a
Gross profit margin 24.7% 1.6pp n/a
-4.2pp
1.4pp 4.4pp