Kodak 2008 Annual Report Download - page 95
Download and view the complete annual report
Please find page 95 of the 2008 Kodak annual report below. You can navigate through the pages in the report by either clicking on the pages listed below, or by using the keyword search tool below to find specific information within the annual report.-
 1
1 -
2
-
3
-
4
-
5
-
6
-
7
-
8
-
9
-
10
-
11
-
12
-
13
-
14
-
15
-
16
-
17
-
18
-
19
-
20
-
21
-
22
-
23
-
24
-
25
-
26
-
27
-
28
-
29
-
30
-
31
-
32
-
33
-
34
-
35
-
36
-
37
-
38
-
39
-
40
-
41
-
42
-
43
-
44
-
45
-
46
-
47
-
48
-
49
-
50
-
51
-
52
-
53
-
54
-
55
-
56
-
57
-
58
-
59
-
60
-
61
-
62
-
63
-
64
-
65
-
66
-
67
-
68
-
69
-
70
-
71
-
72
-
73
-
74
-
75
-
76
-
77
-
78
-
79
-
80
-
81
-
82
-
83
-
84
-
 85
85 -
 86
86 -
 87
87 -
 88
88 -
 89
89 -
 90
90 -
 91
91 -
 92
92 -
 93
93 -
 94
94 -
 95
95 -
 96
96 -
 97
97 -
 98
98 -
 99
99 -
 100
100 -
 101
101 -
 102
102 -
 103
103 -
 104
104 -
 105
105 -
106
-
107
-
108
-
109
-
110
-
111
-
112
-
113
-
114
-
115
-
116
-
117
-
118
-
119
-
120
-
121
-
122
-
123
-
124
-
125
-
126
-
127
-
128
-
129
-
130
-
131
-
132
-
133
-
134
-
135
-
136
-
137
-
138
-
139
-
140
-
141
-
142
-
143
-
144
-
145
-
146
-
147
-
148
-
149
-
150
-
151
-
152
-
153
-
154
-
155
-
156
-
157
-
158
-
159
-
160
-
161
-
162
-
163
-
164
-
165
-
166
-
167
-
168
-
169
-
170
-
171
-
172
-
173
-
174
-
175
-
176
-
177
-
178
-
179
-
180
-
181
-
182
-
183
-
184
-
185
-
186
-
187
-
188
-
189
-
190
-
191
-
192
-
193
-
194
-
195
-
196
-
197
-
198
-
199
-
200
-
201
-
202
-
203
-
204
-
205
-
206
-
207
-
208
-
209
-
210
-
211
-
212
-
213
-
214
-
215
-
216
 |
 |

93
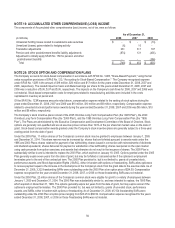
The estimated prior service credit and net actuarial loss that will be amortized from Accumulated other comprehensive income (loss)
into net periodic benefit cost over the next fiscal year is $70 million and $19 million, respectively.
The U.S. plan represents approximately 95% of the total other postretirement net benefit obligation as of December 31, 2008 and
2007 and, therefore, the weighted-average assumptions used to compute the other postretirement benefit amounts approximate the
U.S. assumptions.
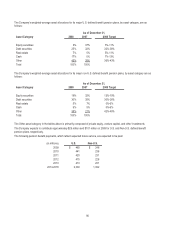
The weighted-average assumptions used to determine the net benefit obligations were as follows:
As of December 31,
2008
2007
Discount rate 7.00%
6.46%
Salary increase rate 4.00%
4.38%
The weighted-average assumptions used to determine the net postretirement benefit cost were as follows:
For the Year Ended December 31,
2008
2007
Discount rate 7.23%
5.98%
Salary increase rate 4.48%
4.49%
The weighted-average assumed healthcare cost trend rates used to compute the other postretirement amounts were as follows:
2008 2007
Healthcare cost trend 8.00% 8.00%
Rate to which the cost trend rate is assumed to decline
(the ultimate trend rate) 5.00% 5.00%
Year that the rate reaches the ultimate trend rate 2012 2011
Assumed healthcare cost trend rates have a significant effect on the amounts reported for the healthcare plans. A one-percentage
point change in assumed healthcare cost trend rates would have the following effects:
(in millions) 1% increase
1% decrease
Effect on total service and interest cost $ 2
$(2)
Effect on postretirement benefit obligation 33
(29)
The Company expects to make $175 million of benefit payments for its unfunded other postretirement benefit plans in 2009.
The following other postretirement benefits, which reflect expected future service, are expected to be paid:
(in millions)
2009 $ 175
2010 167
2011 159
2012 156
2013 142
2014-2018 610