Kodak 2008 Annual Report Download - page 29
Download and view the complete annual report
Please find page 29 of the 2008 Kodak annual report below. You can navigate through the pages in the report by either clicking on the pages listed below, or by using the keyword search tool below to find specific information within the annual report.-
 1
1 -
2
-
3
-
4
-
5
-
6
-
7
-
8
-
9
-
10
-
11
-
12
-
13
-
14
-
15
-
16
-
17
-
18
-
 19
19 -
 20
20 -
 21
21 -
 22
22 -
 23
23 -
 24
24 -
 25
25 -
 26
26 -
 27
27 -
 28
28 -
 29
29 -
 30
30 -
 31
31 -
 32
32 -
 33
33 -
 34
34 -
 35
35 -
 36
36 -
 37
37 -
 38
38 -
 39
39 -
40
-
41
-
42
-
43
-
44
-
45
-
46
-
47
-
48
-
49
-
50
-
51
-
52
-
53
-
54
-
55
-
56
-
57
-
58
-
59
-
60
-
61
-
62
-
63
-
64
-
65
-
66
-
67
-
68
-
69
-
70
-
71
-
72
-
73
-
74
-
75
-
76
-
77
-
78
-
79
-
80
-
81
-
82
-
83
-
84
-
85
-
86
-
87
-
88
-
89
-
90
-
91
-
92
-
93
-
94
-
95
-
96
-
97
-
98
-
99
-
100
-
101
-
102
-
103
-
104
-
105
-
106
-
107
-
108
-
109
-
110
-
111
-
112
-
113
-
114
-
115
-
116
-
117
-
118
-
119
-
120
-
121
-
122
-
123
-
124
-
125
-
126
-
127
-
128
-
129
-
130
-
131
-
132
-
133
-
134
-
135
-
136
-
137
-
138
-
139
-
140
-
141
-
142
-
143
-
144
-
145
-
146
-
147
-
148
-
149
-
150
-
151
-
152
-
153
-
154
-
155
-
156
-
157
-
158
-
159
-
160
-
161
-
162
-
163
-
164
-
165
-
166
-
167
-
168
-
169
-
170
-
171
-
172
-
173
-
174
-
175
-
176
-
177
-
178
-
179
-
180
-
181
-
182
-
183
-
184
-
185
-
186
-
187
-
188
-
189
-
190
-
191
-
192
-
193
-
194
-
195
-
196
-
197
-
198
-
199
-
200
-
201
-
202
-
203
-
204
-
205
-
206
-
207
-
208
-
209
-
210
-
211
-
212
-
213
-
214
-
215
-
216
 |
 |

27
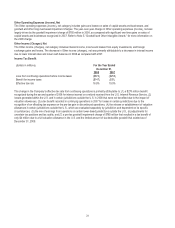
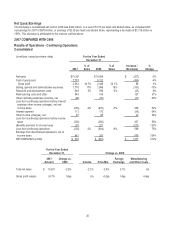
The changes in cost allocation methodologies referred to above increased (decreased) segment operating results for the years
ended December 31, 2007 and 2006 as follows:
For the Year Ended December 31,
(in millions) 2007
2006
Consumer Digital Imaging Group $ (32)
$ (54)
Film, Photofinishing and Entertainment Group 28 75
Graphic Communications Group (23)
(57)
All Other 27
36
Consolidated impact $ -
$-
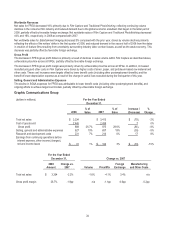
DETAILED RESULTS OF OPERATIONS
Net Sales from Continuing Operations by Reportable Segment and All Other (1)
For the Year Ended December 31,
(in millions) 2008 Change
Foreign
Currency
Impact 2007 Change
Foreign
Currency
Impact 2006
Consumer Digital Imaging Group
Inside the U.S. $ 1,811 -10% 0% $ 2,012 +5% 0% $ 1,910
Outside the U.S. 1,277 +3 +3 1,235 +12 +7 1,103
Total Consumer Digital
Imaging Group 3,088 -5 +1 3,247 +8 +3 3,013
Film, Photofinishing and
Entertainment Group
Inside the U.S. 835 -21 0 1,054 -23 0 1,366
Outside the U.S. 2,152 -17 +3 2,578 -11 +4 2,888
Total Film, Photofinishing and
Entertainment Group 2,987 -18 +2 3,632 -15 +3 4,254
Graphic Communications Group
Inside the U.S. 1,036 -12 0 1,178 -4 0 1,231
Outside the U.S. 2,298 +3 +5 2,235 +9 +7 2,056
Total Graphic
Communications Group 3,334 -2 +3 3,413 +4 +4 3,287
All Other
Inside the U.S. 7 10 12
Outside the U.S. - (1)2
Total All Other 7 914
Consolidated
Inside the U.S. 3,689 -13 0 4,254 -6 0 4,519
Outside the U.S. 5,727 -5 +4 6,047 0 +5 6,049
Consolidated Total $ 9,416 -9% +2% $ 10,301 -3% +3% $ 10,568
(1) Sales are reported based on the geographic area of destination.