Kodak 2008 Annual Report Download - page 31
Download and view the complete annual report
Please find page 31 of the 2008 Kodak annual report below. You can navigate through the pages in the report by either clicking on the pages listed below, or by using the keyword search tool below to find specific information within the annual report.-
 1
1 -
2
-
3
-
4
-
5
-
6
-
7
-
8
-
9
-
10
-
11
-
12
-
13
-
14
-
15
-
16
-
17
-
18
-
19
-
20
-
 21
21 -
 22
22 -
 23
23 -
 24
24 -
 25
25 -
 26
26 -
 27
27 -
 28
28 -
 29
29 -
 30
30 -
 31
31 -
 32
32 -
 33
33 -
 34
34 -
 35
35 -
 36
36 -
 37
37 -
 38
38 -
 39
39 -
 40
40 -
 41
41 -
42
-
43
-
44
-
45
-
46
-
47
-
48
-
49
-
50
-
51
-
52
-
53
-
54
-
55
-
56
-
57
-
58
-
59
-
60
-
61
-
62
-
63
-
64
-
65
-
66
-
67
-
68
-
69
-
70
-
71
-
72
-
73
-
74
-
75
-
76
-
77
-
78
-
79
-
80
-
81
-
82
-
83
-
84
-
85
-
86
-
87
-
88
-
89
-
90
-
91
-
92
-
93
-
94
-
95
-
96
-
97
-
98
-
99
-
100
-
101
-
102
-
103
-
104
-
105
-
106
-
107
-
108
-
109
-
110
-
111
-
112
-
113
-
114
-
115
-
116
-
117
-
118
-
119
-
120
-
121
-
122
-
123
-
124
-
125
-
126
-
127
-
128
-
129
-
130
-
131
-
132
-
133
-
134
-
135
-
136
-
137
-
138
-
139
-
140
-
141
-
142
-
143
-
144
-
145
-
146
-
147
-
148
-
149
-
150
-
151
-
152
-
153
-
154
-
155
-
156
-
157
-
158
-
159
-
160
-
161
-
162
-
163
-
164
-
165
-
166
-
167
-
168
-
169
-
170
-
171
-
172
-
173
-
174
-
175
-
176
-
177
-
178
-
179
-
180
-
181
-
182
-
183
-
184
-
185
-
186
-
187
-
188
-
189
-
190
-
191
-
192
-
193
-
194
-
195
-
196
-
197
-
198
-
199
-
200
-
201
-
202
-
203
-
204
-
205
-
206
-
207
-
208
-
209
-
210
-
211
-
212
-
213
-
214
-
215
-
216
 |
 |

29
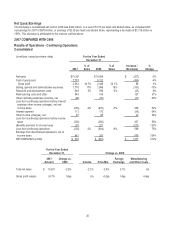
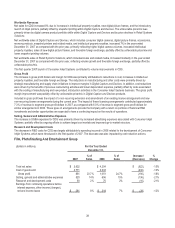
2008 COMPARED WITH 2007
Results of Operations – Continuing Operations
Consolidated
(in millions, except per share data) For the Year Ended
December 31,
2008
%of
Sales 2007
%of
Sales
Increase /
(Decrease)
%
Change
Net sales $ 9,416 $10,301 $ (885) -9%
Cost of goods sold 7,247 7,757 (510)-7%
Gross profit 2,169 23.0% 2,544 24.7% (375) -15%
Selling, general and administrative expenses 1,583 17% 1,778 17% (195) -11%
Research and development costs 501 5% 549 5% (48) -9%
Restructuring costs, rationalization and other 140 543 (403) -74%
Other operating expenses (income), net 766 (96) 862 -898%
Loss from continuing operations before interest
expense, other income (charges), net and
income taxes (821) -9% (230) -2% (591) -257%
Interest expense 108 113 (5) -4%
Other income (charges), net 55 87 (32) -37%
Loss from continuing operations before income
taxes (874) (256) (618) -241%
Benefit for income taxes (147)(51)(96) 188%
Loss from continuing operations (727) -8% (205) -2% (522) -255%
Earnings from discontinued operations, net of
income taxes 285 881 (596) -68%
NET (LOSS) EARNINGS $ (442) $ 676 $ (1,118) -165%
For the Year Ended
December 31, Change vs. 2007
2008
Amount
Change vs.
2007 Volume
Price/Mix
Foreign
Exchange
Manufacturing
and Other Costs
Total net sales $ 9,416 -8.6% -4.4%
-6.4%
2.2% n/a
Gross profit margin 23.0% -1.7pp n/a
-5.5pp
0.2pp 3.6pp
As noted earlier in this MD&A, the Company's results of operations were severely affected by the economic downturn that
accelerated in late 2008. The normal seasonality of the Company, which is heavily skewed to the second half of the year, further
magnified the effects of the economic downturn on its results. The last four months of 2008 saw the global retail markets collapse,
which affected the Company’s various consumer businesses, combined with a rapid decline in global print demand which affected its
GCG businesses. In response, the Company has outlined actions to focus business investments in certain areas that are core to the
Company's strategy, while also maintaining an intense focus on cash generation and conservation in 2009.