Kodak 2008 Annual Report Download - page 106
Download and view the complete annual report
Please find page 106 of the 2008 Kodak annual report below. You can navigate through the pages in the report by either clicking on the pages listed below, or by using the keyword search tool below to find specific information within the annual report.-
 1
1 -
2
-
3
-
4
-
5
-
6
-
7
-
8
-
9
-
10
-
11
-
12
-
13
-
14
-
15
-
16
-
17
-
18
-
19
-
20
-
21
-
22
-
23
-
24
-
25
-
26
-
27
-
28
-
29
-
30
-
31
-
32
-
33
-
34
-
35
-
36
-
37
-
38
-
39
-
40
-
41
-
42
-
43
-
44
-
45
-
46
-
47
-
48
-
49
-
50
-
51
-
52
-
53
-
54
-
55
-
56
-
57
-
58
-
59
-
60
-
61
-
62
-
63
-
64
-
65
-
66
-
67
-
68
-
69
-
70
-
71
-
72
-
73
-
74
-
75
-
76
-
77
-
78
-
79
-
80
-
81
-
82
-
83
-
84
-
85
-
86
-
87
-
88
-
89
-
90
-
91
-
92
-
93
-
94
-
95
-
 96
96 -
 97
97 -
 98
98 -
 99
99 -
 100
100 -
 101
101 -
 102
102 -
 103
103 -
 104
104 -
 105
105 -
 106
106 -
 107
107 -
 108
108 -
 109
109 -
 110
110 -
 111
111 -
 112
112 -
 113
113 -
 114
114 -
 115
115 -
 116
116 -
117
-
118
-
119
-
120
-
121
-
122
-
123
-
124
-
125
-
126
-
127
-
128
-
129
-
130
-
131
-
132
-
133
-
134
-
135
-
136
-
137
-
138
-
139
-
140
-
141
-
142
-
143
-
144
-
145
-
146
-
147
-
148
-
149
-
150
-
151
-
152
-
153
-
154
-
155
-
156
-
157
-
158
-
159
-
160
-
161
-
162
-
163
-
164
-
165
-
166
-
167
-
168
-
169
-
170
-
171
-
172
-
173
-
174
-
175
-
176
-
177
-
178
-
179
-
180
-
181
-
182
-
183
-
184
-
185
-
186
-
187
-
188
-
189
-
190
-
191
-
192
-
193
-
194
-
195
-
196
-
197
-
198
-
199
-
200
-
201
-
202
-
203
-
204
-
205
-
206
-
207
-
208
-
209
-
210
-
211
-
212
-
213
-
214
-
215
-
216
 |
 |
104
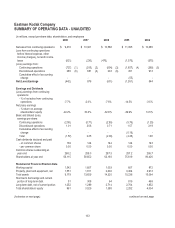
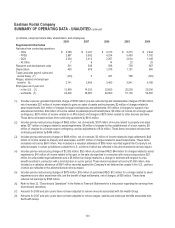
Eastman Kodak Company
SUMMARY OF OPERATING DATA - UNAUDITED continued
(in millions, except per share data, shareholders, and employees)
2008 2007
2006
2005 2004
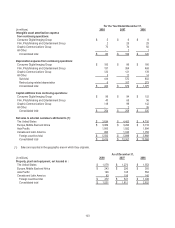
Supplemental Information
Net sales from continuing operations
- CDG $ 3,088 $ 3,247
$ 3,013
$ 3,315 $ 2,444
- FPEG 2,987 3,632
4,254
5,453 7,152
- GCG 3,334 3,413
3,287
2,604 1,049
- All Other 7 9
14
23 20
Research and development costs 501 549
596
739 667
Depreciation 420 679
1,075
1,191 850
Taxes (excludes payroll, sales and
excise taxes) (7) (105) 5
327
798 (100)
Wages, salaries and employee
benefits (8) 2,141 2,846
3,480
3,941 4,188
Employees as of year end
- in the U.S. (7) 12,800 14,200
20,600
25,500 29,200
- worldwide (7) 24,400 26,900
40,900
51,100 54,800
(1) Includes a pre-tax goodwill impairment charge of $785 million; pre-tax restructuring and rationalization charges of $149 million,
net of reversals; $21 million of income related to gains on sales of assets and businesses; $3 million of charges related to
asset impairments; $41 million of charges for legal contingencies and settlements; $10 million of charges for support of an
educational institution; $94 million of income related to postemployment benefit plans; $3 million of income for a foreign export
contingency; $270 million of income related to an IRS refund; and charges of $27 million related to other discrete tax items.
These items increased net loss from continuing operations by $610 million.
(2) Includes pre-tax restructuring charges of $662 million, net of reversals; $157 million of income related to property and asset
sales; $57 million of charges related to asset impairments; $6 million of charges for the establishment of a loan reserve; $9
million of charges for a foreign export contingency; and tax adjustments of $14 million. These items increased net loss from
continuing operations by $464 million.
(3) Includes pre-tax restructuring charges of $698 million, net of reversals; $2 million of income related to legal settlements; $46
million of income related to property and asset sales; and $11 million of charges related to asset impairments. These items
increased net loss by $691 million. Also included is a valuation allowance of $89 million recorded against the Company's net
deferred assets in certain jurisdictions outside the U.S., portions of which are reflected in the aforementioned net loss impact.
(4) Includes pre-tax restructuring charges of $1,092 million; $52 million of purchased R&D; $44 million for charges related to asset
impairments; $41 million of income related to the gain on the sale of properties in connection with restructuring actions; $21
million for unfavorable legal settlements and a $6 million tax charge related to a change in estimate with respect to a tax
benefit recorded in connection with a land donation in a prior period. These items increased net loss by $1,080 million. Also
included is a valuation allowance of $961 million recorded against the Company's net deferred tax assets in the U.S., portions
of which are reflected in the aforementioned net loss impact.
(5) Includes pre-tax restructuring charges of $873 million; $16 million of purchased R&D; $12 million for a charge related to asset
impairments and other asset write-offs; and the benefit of legal settlements, net of charges, of $95 million. These items
reduced net earnings by $595 million.
(6) Refer to Note 22, “Discontinued Operations” in the Notes to Financial Statements for a discussion regarding the earnings from
discontinued operations.
(7) Amounts for 2006 and prior years have not been adjusted to remove amounts associated with the Health Group.
(8) Amounts for 2007 and prior years have not been adjusted to remove wages, salaries and employee benefits associated with
the Health Group.