Kodak 2008 Annual Report Download - page 101
Download and view the complete annual report
Please find page 101 of the 2008 Kodak annual report below. You can navigate through the pages in the report by either clicking on the pages listed below, or by using the keyword search tool below to find specific information within the annual report.-
 1
1 -
2
-
3
-
4
-
5
-
6
-
7
-
8
-
9
-
10
-
11
-
12
-
13
-
14
-
15
-
16
-
17
-
18
-
19
-
20
-
21
-
22
-
23
-
24
-
25
-
26
-
27
-
28
-
29
-
30
-
31
-
32
-
33
-
34
-
35
-
36
-
37
-
38
-
39
-
40
-
41
-
42
-
43
-
44
-
45
-
46
-
47
-
48
-
49
-
50
-
51
-
52
-
53
-
54
-
55
-
56
-
57
-
58
-
59
-
60
-
61
-
62
-
63
-
64
-
65
-
66
-
67
-
68
-
69
-
70
-
71
-
72
-
73
-
74
-
75
-
76
-
77
-
78
-
79
-
80
-
81
-
82
-
83
-
84
-
85
-
86
-
87
-
88
-
89
-
90
-
 91
91 -
 92
92 -
 93
93 -
 94
94 -
 95
95 -
 96
96 -
 97
97 -
 98
98 -
 99
99 -
 100
100 -
 101
101 -
 102
102 -
 103
103 -
 104
104 -
 105
105 -
 106
106 -
 107
107 -
 108
108 -
 109
109 -
 110
110 -
 111
111 -
112
-
113
-
114
-
115
-
116
-
117
-
118
-
119
-
120
-
121
-
122
-
123
-
124
-
125
-
126
-
127
-
128
-
129
-
130
-
131
-
132
-
133
-
134
-
135
-
136
-
137
-
138
-
139
-
140
-
141
-
142
-
143
-
144
-
145
-
146
-
147
-
148
-
149
-
150
-
151
-
152
-
153
-
154
-
155
-
156
-
157
-
158
-
159
-
160
-
161
-
162
-
163
-
164
-
165
-
166
-
167
-
168
-
169
-
170
-
171
-
172
-
173
-
174
-
175
-
176
-
177
-
178
-
179
-
180
-
181
-
182
-
183
-
184
-
185
-
186
-
187
-
188
-
189
-
190
-
191
-
192
-
193
-
194
-
195
-
196
-
197
-
198
-
199
-
200
-
201
-
202
-
203
-
204
-
205
-
206
-
207
-
208
-
209
-
210
-
211
-
212
-
213
-
214
-
215
-
216
 |
 |

99
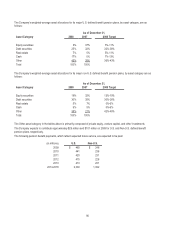
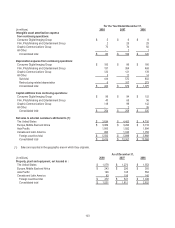
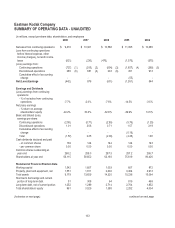
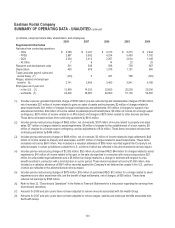
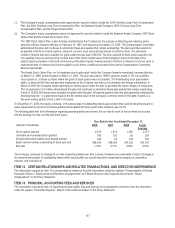
Segment financial information is shown below. Prior period results have been restated to conform to the current period segment
reporting structure.
For the Year Ended December 31,
(in millions) 2008 2007 2006
Net sales from continuing operations:
Consumer Digital Imaging Group $ 3,088 $ 3,247 $ 3,013
Film, Photofinishing and Entertainment Group 2,987 3,632 4,254
Graphic Communications Group 3,334 3,413 3,287
All Other 7 914
Consolidated total $ 9,416 $ 10,301 $ 10,568
(Loss) earnings from continuing operations before
interest expense, other income (charges), net and
income taxes:
Consumer Digital Imaging Group $ (177) $ (17) $ (206)
Film, Photofinishing and Entertainment Group 196 281 319
Graphic Communications Group 31 104 70
All Other (17)(25)(22)
Total of segments 33 343 161
Restructuring costs, rationalization and other (149) (662) (698)
Postemployment benefit changes 94 - -
Other operating (expenses) income, net (766) 96 59
Adjustments to contingencies and legal
reserves/settlements (33) (7) 2
Interest expense (108) (113) (172)
Other income (charges), net 55 87 65
Consolidated loss from continuing operations before
income taxes $ (874) $ (256) $ (583)
As of December 31,
(in millions) 2008 2007 2006
Segment total assets:
Consumer Digital Imaging Group $ 1,647 $ 2,442 $ 2,108
Film, Photofinishing and Entertainment Group 2,563 3,778 4,372
Graphic Communications Group 2,190 3,723 3,864
All Other 8 17 18
Total of segments 6,408 9,960 10,362
Cash and marketable securities 2,155 2,976 1,487
Deferred income tax assets 620 757 750
Other corporate reserves (4) (34) (158)
Assets of discontinued operations - -1,879
Consolidated total assets $ 9,179 $ 13,659 $ 14,320