Kodak 2008 Annual Report Download - page 68
Download and view the complete annual report
Please find page 68 of the 2008 Kodak annual report below. You can navigate through the pages in the report by either clicking on the pages listed below, or by using the keyword search tool below to find specific information within the annual report.-
 1
1 -
2
-
3
-
4
-
5
-
6
-
7
-
8
-
9
-
10
-
11
-
12
-
13
-
14
-
15
-
16
-
17
-
18
-
19
-
20
-
21
-
22
-
23
-
24
-
25
-
26
-
27
-
28
-
29
-
30
-
31
-
32
-
33
-
34
-
35
-
36
-
37
-
38
-
39
-
40
-
41
-
42
-
43
-
44
-
45
-
46
-
47
-
48
-
49
-
50
-
51
-
52
-
53
-
54
-
55
-
56
-
57
-
 58
58 -
 59
59 -
 60
60 -
 61
61 -
 62
62 -
 63
63 -
 64
64 -
 65
65 -
 66
66 -
 67
67 -
 68
68 -
 69
69 -
 70
70 -
 71
71 -
 72
72 -
 73
73 -
 74
74 -
 75
75 -
 76
76 -
 77
77 -
 78
78 -
79
-
80
-
81
-
82
-
83
-
84
-
85
-
86
-
87
-
88
-
89
-
90
-
91
-
92
-
93
-
94
-
95
-
96
-
97
-
98
-
99
-
100
-
101
-
102
-
103
-
104
-
105
-
106
-
107
-
108
-
109
-
110
-
111
-
112
-
113
-
114
-
115
-
116
-
117
-
118
-
119
-
120
-
121
-
122
-
123
-
124
-
125
-
126
-
127
-
128
-
129
-
130
-
131
-
132
-
133
-
134
-
135
-
136
-
137
-
138
-
139
-
140
-
141
-
142
-
143
-
144
-
145
-
146
-
147
-
148
-
149
-
150
-
151
-
152
-
153
-
154
-
155
-
156
-
157
-
158
-
159
-
160
-
161
-
162
-
163
-
164
-
165
-
166
-
167
-
168
-
169
-
170
-
171
-
172
-
173
-
174
-
175
-
176
-
177
-
178
-
179
-
180
-
181
-
182
-
183
-
184
-
185
-
186
-
187
-
188
-
189
-
190
-
191
-
192
-
193
-
194
-
195
-
196
-
197
-
198
-
199
-
200
-
201
-
202
-
203
-
204
-
205
-
206
-
207
-
208
-
209
-
210
-
211
-
212
-
213
-
214
-
215
-
216
 |
 |

66
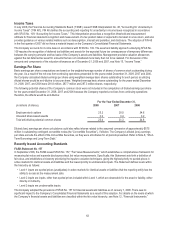
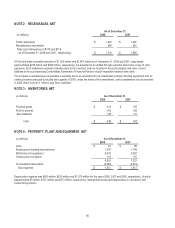
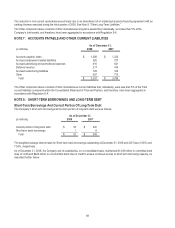
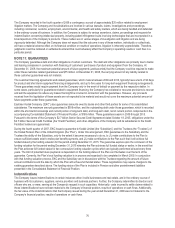
NOTE 2: RECEIVABLES, NET
As of December 31,
(in millions) 2008 2007
Trade receivables $ 1,330 $ 1,697
Miscellaneous receivables 386 242
Total (net of allowances of $113 and $114
as of December 31, 2008 and 2007, respectively) $ 1,716 $ 1,939
Of the total trade receivable amounts of $1,330 million and $1,697 million as of December 31, 2008 and 2007, respectively,
approximately $218 million and $266 million, respectively, are expected to be settled through customer deductions in lieu of cash
payments. Such deductions represent rebates owed to the customer and are included in Accounts payable and other current
liabilities in the accompanying Consolidated Statement of Financial Position at each respective balance sheet date.
The increase in miscellaneous receivables is primarily due to an amendment to an intellectual property licensing agreement with an
existing licensee executed during the third quarter of 2008. Under the terms of this amendment, cash consideration is to be received
in 2009. Refer to Note 9, “Other Long-Term Liabilities.”
NOTE 3: INVENTORIES, NET
(in millions) As of December 31,
2008 2007
Finished goods $ 610 $ 537
Work in process 193 235
Raw materials 145 171
Total $ 948 $ 943
NOTE 4: PROPERTY, PLANT AND EQUIPMENT, NET
(in millions) As of December 31,
2008
2007
Land $ 81
$85
Buildings and building improvements 1,575
1,748
Machinery and equipment 5,033
5,387
Construction in progress 116
107
6,805
7,327
Accumulated depreciation (5,254)
(5,516)
Net properties $ 1,551
$ 1,811
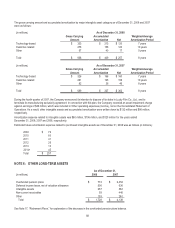
Depreciation expense was $420 million, $679 million and $1,075 million for the years 2008, 2007 and 2006, respectively, of which
approximately $6 million, $107 million and $273 million, respectively, represented accelerated depreciation in connection with
restructuring actions.