Kodak 2008 Annual Report Download - page 40
Download and view the complete annual report
Please find page 40 of the 2008 Kodak annual report below. You can navigate through the pages in the report by either clicking on the pages listed below, or by using the keyword search tool below to find specific information within the annual report.-
 1
1 -
2
-
3
-
4
-
5
-
6
-
7
-
8
-
9
-
10
-
11
-
12
-
13
-
14
-
15
-
16
-
17
-
18
-
19
-
20
-
21
-
22
-
23
-
24
-
25
-
26
-
27
-
28
-
29
-
 30
30 -
 31
31 -
 32
32 -
 33
33 -
 34
34 -
 35
35 -
 36
36 -
 37
37 -
 38
38 -
 39
39 -
 40
40 -
 41
41 -
 42
42 -
 43
43 -
 44
44 -
 45
45 -
 46
46 -
 47
47 -
 48
48 -
 49
49 -
 50
50 -
51
-
52
-
53
-
54
-
55
-
56
-
57
-
58
-
59
-
60
-
61
-
62
-
63
-
64
-
65
-
66
-
67
-
68
-
69
-
70
-
71
-
72
-
73
-
74
-
75
-
76
-
77
-
78
-
79
-
80
-
81
-
82
-
83
-
84
-
85
-
86
-
87
-
88
-
89
-
90
-
91
-
92
-
93
-
94
-
95
-
96
-
97
-
98
-
99
-
100
-
101
-
102
-
103
-
104
-
105
-
106
-
107
-
108
-
109
-
110
-
111
-
112
-
113
-
114
-
115
-
116
-
117
-
118
-
119
-
120
-
121
-
122
-
123
-
124
-
125
-
126
-
127
-
128
-
129
-
130
-
131
-
132
-
133
-
134
-
135
-
136
-
137
-
138
-
139
-
140
-
141
-
142
-
143
-
144
-
145
-
146
-
147
-
148
-
149
-
150
-
151
-
152
-
153
-
154
-
155
-
156
-
157
-
158
-
159
-
160
-
161
-
162
-
163
-
164
-
165
-
166
-
167
-
168
-
169
-
170
-
171
-
172
-
173
-
174
-
175
-
176
-
177
-
178
-
179
-
180
-
181
-
182
-
183
-
184
-
185
-
186
-
187
-
188
-
189
-
190
-
191
-
192
-
193
-
194
-
195
-
196
-
197
-
198
-
199
-
200
-
201
-
202
-
203
-
204
-
205
-
206
-
207
-
208
-
209
-
210
-
211
-
212
-
213
-
214
-
215
-
216
 |
 |

38
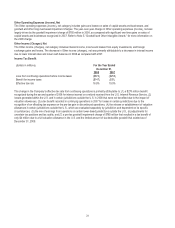
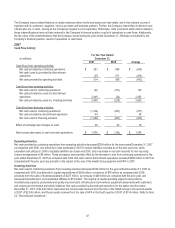
The change in the Company’s annual effective tax rate from continuing operations was primarily attributable to the ability to
recognize a tax benefit in continuing operations associated with the realization of current year losses in certain jurisdictions where it
has historically had a valuation allowance. This was due to the recognition of the pre-tax gain in discontinued operations and due to
the favorable outcome of income tax audits in various jurisdictions around the world.
During the fourth quarter of 2007, based on the Company’s assessment of positive and negative evidence regarding the realization
of the net deferred tax assets, the Company recorded a benefit associated with the release of valuation allowances in certain
jurisdictions outside the U.S.
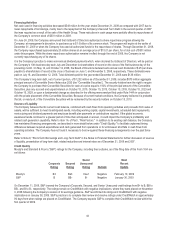
During 2007, the Company reached a settlement with the Internal Revenue Service covering tax years 1999-2000. As a result, the
Company recognized a tax benefit from continuing operations in the U.S. of $17 million, including interest. Also during 2007, the
Company reached a settlement with the taxing authorities in two locations outside of the U.S. resulting in a tax benefit of $76 million.
During the second quarter of 2007, the Company identified a deferred tax asset in a recently acquired non-U.S. subsidiary that was
overstated at the date of acquisition. Therefore, the Company recorded an increase in the value of goodwill of $24 million in the
second quarter of 2007 to appropriately reflect the proper goodwill balance. The Company also recorded a valuation allowance of
$20 million, which should have been recorded in 2006, in order to properly reflect the value of the net deferred tax asset. This
amount is included in the $51 million tax benefit for the year ended December 31, 2007. The Company has determined that this
correction is not material to 2007 or to any prior period financial statement amounts.
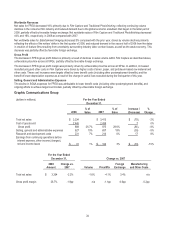
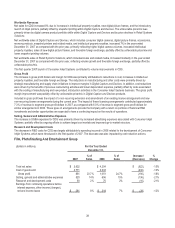
Consumer Digital Imaging Group
(dollars in millions) For the Year Ended
December 31,
2007
%of
Sales 2006
%of
Sales
Increase /
(Decrease)
%
Change
Total net sales $3,247 $ 3,013 $ 234 8%
Cost of goods sold 2,419 2,373 46 2%
Gross profit 828 25.5% 640
21.2%
188 29%
Selling, general and administrative expenses 595 18% 556
18%
39 7%
Research and development costs 250 8% 290
10%
(40) -14%
Loss from continuing operations before
interest expense, other income (charges),
net and income taxes $(17
) -1% $ (206)
-7%
$ 189 92%
For the Year Ended
December 31, Change vs. 2006
2007
Amount
Change vs.
2006 Volume
Price/Mix
Foreign
Exchange
Manufacturing
and Other Costs
Total net sales $ 3,247 7.8% 12.2%
-7.0%
2.6% n/a
Gross profit margin 25.5% 4.3pp n/a
-6.8pp
1.7pp 9.4pp