Kodak 2008 Annual Report Download - page 182
Download and view the complete annual report
Please find page 182 of the 2008 Kodak annual report below. You can navigate through the pages in the report by either clicking on the pages listed below, or by using the keyword search tool below to find specific information within the annual report.-
 1
1 -
2
-
3
-
4
-
5
-
6
-
7
-
8
-
9
-
10
-
11
-
12
-
13
-
14
-
15
-
16
-
17
-
18
-
19
-
20
-
21
-
22
-
23
-
24
-
25
-
26
-
27
-
28
-
29
-
30
-
31
-
32
-
33
-
34
-
35
-
36
-
37
-
38
-
39
-
40
-
41
-
42
-
43
-
44
-
45
-
46
-
47
-
48
-
49
-
50
-
51
-
52
-
53
-
54
-
55
-
56
-
57
-
58
-
59
-
60
-
61
-
62
-
63
-
64
-
65
-
66
-
67
-
68
-
69
-
70
-
71
-
72
-
73
-
74
-
75
-
76
-
77
-
78
-
79
-
80
-
81
-
82
-
83
-
84
-
85
-
86
-
87
-
88
-
89
-
90
-
91
-
92
-
93
-
94
-
95
-
96
-
97
-
98
-
99
-
100
-
101
-
102
-
103
-
104
-
105
-
106
-
107
-
108
-
109
-
110
-
111
-
112
-
113
-
114
-
115
-
116
-
117
-
118
-
119
-
120
-
121
-
122
-
123
-
124
-
125
-
126
-
127
-
128
-
129
-
130
-
131
-
132
-
133
-
134
-
135
-
136
-
137
-
138
-
139
-
140
-
141
-
142
-
143
-
144
-
145
-
146
-
147
-
148
-
149
-
150
-
151
-
152
-
153
-
154
-
155
-
156
-
157
-
158
-
159
-
160
-
161
-
162
-
163
-
164
-
165
-
166
-
167
-
168
-
169
-
170
-
171
-
 172
172 -
 173
173 -
 174
174 -
 175
175 -
 176
176 -
 177
177 -
 178
178 -
 179
179 -
 180
180 -
 181
181 -
 182
182 -
 183
183 -
 184
184 -
 185
185 -
 186
186 -
 187
187 -
 188
188 -
 189
189 -
 190
190 -
 191
191 -
 192
192 -
193
-
194
-
195
-
196
-
197
-
198
-
199
-
200
-
201
-
202
-
203
-
204
-
205
-
206
-
207
-
208
-
209
-
210
-
211
-
212
-
213
-
214
-
215
-
216
 |
 |

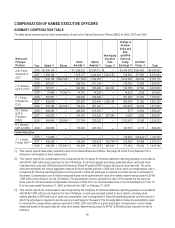
56
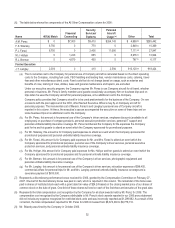
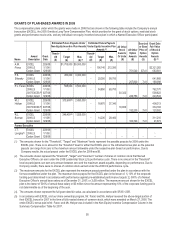
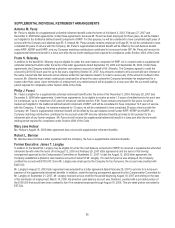
(6) Ms. Hellyar and Mr. Berman had two target bonus percentages during fiscal 2008; in accordance with Company policy, the target
bonus shown in the table above represents Ms. Hellyar's and Mr. Berman’s end-of-year salary multiplied by the weighted-
average target bonus percentage during fiscal 2008.
(7) Mr. Langley was not eligible for an EXCEL bonus for 2008 and did not receive long-term incentive awards due to his termination
with the Company on March 14, 2008.
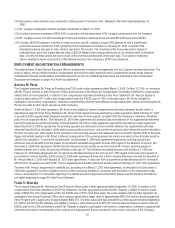
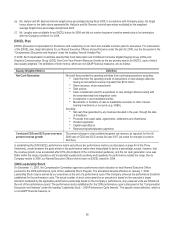
EXCEL Plan
EXCEL (Executive Compensation for Excellence and Leadership) is our short-term variable incentive plan for executives. For a discussion
of the EXCEL plan, target allocations for our Named Executive Officers and performance under the plan for 2008, see the discussion in the
“Compensation Discussion and Analysis” under the heading “Annual Variable Pay.”
In 2008, the Compensation Committee selected Net Cash Generation and Combined Consumer Digital Imaging Group (CDG) and
Graphics Communication Group (GCG) Year-Over-Year Percent Revenue Growth as the two primary metrics for EXCEL, each of which
was equally weighted. The definitions of both metrics, which are non-GAAP financial measures, are as follows:
Equally Weighted Metrics
Definition
Net Cash Generation
Net cash flow provided by operating activities from continuing operations excluding:
•Cash flow from the operating results of acquisitions or new strategic alliances
having an annualized revenue of greater than $100 million
•Share issuance, share repurchases
•Debt actions
•Cash consideration paid for acquisitions or new strategic alliances along with
the associated deal and integration costs
•Investments in unconsolidated entities
•Movements or transfers of case to marketable securities or other interest-
bearing investments or accounts (e.g. VEBA)
Including:
•Net cash flow generated by any business divested in the year, through the date
of divestiture
•Proceeds from asset sales, agreements, settlements and divestitures
•Dividend payments
•Capital expenditures
•Restructuring/rationalization payments
Combined CDG and GCG year-over-year
percent revenue growth
The percent change in total combined segment net revenue, as reported, for the full
2008 year of CDG and GCG versus full year 2007 (as recast for changes in product
structure).
In establishing the 2008 EXCEL performance matrix using these two performance metrics (as discussed on page 40 of this Proxy
Statement), results between the goals shown in the performance matrix were interpolated to derive a percentage, except, however, that
the revenue growth curve accelerated after 8.5% (the midpoint of the communicated guidance), and the net cash generation curve was
flatter within the range of guidance and accelerated equally both positively and negatively for performance outside the range. Due to
Company results in 2008, our Named Executive Officers did not earn an EXCEL award for 2008.
2008 Leadership Stock
On December 11, 2007, the Compensation Committee approved a performance stock allocation to each Named Executive Officer
pursuant to the 2008 performance cycle of the Leadership Stock Program. The allocations became effective on January 1, 2008.
Leadership Stock may be earned by our executives at the end of a performance cycle if the Company achieves the performance threshold
established for the performance cycle. The actual number of stock units earned by an executive is based on the executive’s target
allocation multiplied by the applicable performance percentage based on the Company’s performance. Any unearned units are forfeited at
the end of the performance period. The performance metric established for the 2008 performance cycle is discussed in the “Compensation
Discussion and Analysis” under the heading “Leadership Stock – 2008 Performance Cycle Awards.” The specific metric definition, which is
a non-GAPP financial measure, is: