Kodak 2008 Annual Report Download - page 35
Download and view the complete annual report
Please find page 35 of the 2008 Kodak annual report below. You can navigate through the pages in the report by either clicking on the pages listed below, or by using the keyword search tool below to find specific information within the annual report.-
 1
1 -
2
-
3
-
4
-
5
-
6
-
7
-
8
-
9
-
10
-
11
-
12
-
13
-
14
-
15
-
16
-
17
-
18
-
19
-
20
-
21
-
22
-
23
-
24
-
 25
25 -
 26
26 -
 27
27 -
 28
28 -
 29
29 -
 30
30 -
 31
31 -
 32
32 -
 33
33 -
 34
34 -
 35
35 -
 36
36 -
 37
37 -
 38
38 -
 39
39 -
 40
40 -
 41
41 -
 42
42 -
 43
43 -
 44
44 -
 45
45 -
46
-
47
-
48
-
49
-
50
-
51
-
52
-
53
-
54
-
55
-
56
-
57
-
58
-
59
-
60
-
61
-
62
-
63
-
64
-
65
-
66
-
67
-
68
-
69
-
70
-
71
-
72
-
73
-
74
-
75
-
76
-
77
-
78
-
79
-
80
-
81
-
82
-
83
-
84
-
85
-
86
-
87
-
88
-
89
-
90
-
91
-
92
-
93
-
94
-
95
-
96
-
97
-
98
-
99
-
100
-
101
-
102
-
103
-
104
-
105
-
106
-
107
-
108
-
109
-
110
-
111
-
112
-
113
-
114
-
115
-
116
-
117
-
118
-
119
-
120
-
121
-
122
-
123
-
124
-
125
-
126
-
127
-
128
-
129
-
130
-
131
-
132
-
133
-
134
-
135
-
136
-
137
-
138
-
139
-
140
-
141
-
142
-
143
-
144
-
145
-
146
-
147
-
148
-
149
-
150
-
151
-
152
-
153
-
154
-
155
-
156
-
157
-
158
-
159
-
160
-
161
-
162
-
163
-
164
-
165
-
166
-
167
-
168
-
169
-
170
-
171
-
172
-
173
-
174
-
175
-
176
-
177
-
178
-
179
-
180
-
181
-
182
-
183
-
184
-
185
-
186
-
187
-
188
-
189
-
190
-
191
-
192
-
193
-
194
-
195
-
196
-
197
-
198
-
199
-
200
-
201
-
202
-
203
-
204
-
205
-
206
-
207
-
208
-
209
-
210
-
211
-
212
-
213
-
214
-
215
-
216
 |
 |

33
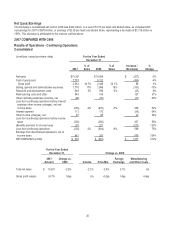
Gross Profit
The decrease in gross profit dollars and margin for CDG was primarily attributable to unfavorable price/mix within Digital Capture
and Devices and lower intellectual property royalties, partially offset by reduced manufacturing and other costs primarily in consumer
inkjet printers, digital cameras and digital frames, as well as favorable foreign exchange.
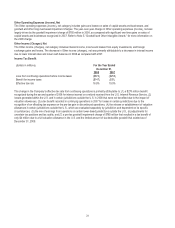
Included in gross profit was a non-recurring amendment of an intellectual property licensing agreement with an existing licensee and
a new non-recurring intellectual licensing agreement. The impact of these agreements contributed approximately 7.4% of segment
revenue to segment gross profit dollars in the current year, as compared with 7.3% of segment revenue to segment gross profit
dollars for non-recurring agreements in the prior year. The new agreement also provides the Company with an opportunity for
continued collaboration with the licensee.
The results also included approximately $126 million related to intellectual property licensing arrangements under which the
Company’s continuing obligations were fulfilled as of December 31, 2008. The Company expects to secure other new licensing
agreements, the timing and amounts of which are difficult to predict. These types of arrangements provide the Company with a
return on portions of historical R&D investments, and new licensing opportunities are expected to have a continuing impact on the
results of operations.
Selling, General and Administrative Expenses
The decrease in SG&A expenses for CDG was primarily driven by ongoing efforts to achieve target cost models and lower benefit
costs (including other postemployment benefits), partially offset by unfavorable foreign exchange.
Research and Development Costs
The decrease in R&D costs for CDG was primarily attributable to reduced spending in 2008 as compared with the prior year due to
the introduction of consumer inkjet printers in 2007, as well as cost reduction actions taken throughout the segment in 2008.
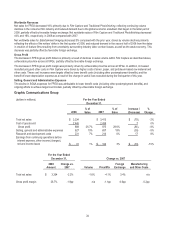
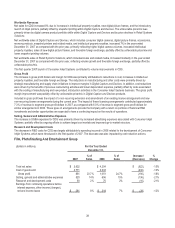
Film, Photofinishing And Entertainment Group
(dollars in millions) For the Year Ended
December 31,
2008
%of
Sales
2007
%of
Sales
Increase /
(Decrease)
%
Change
Total net sales $ 2,987
$ 3,632
$ (645) -18%
Cost of goods sold 2,335
2,771
(436) -16%
Gross profit 652 21.8%
861
23.7% (209) -24%
Selling, general and administrative expenses 404 14%
520
14% (116) -22%
Research and development costs 52 2%
60
2% (8) -13%
Earnings from continuing operations before
interest expense, other income (charges),
net and income taxes $ 196 7%
$ 281
8% $ (85)-30%
For the Year Ended
December 31, Change vs. 2007
2008
Amount
Change vs.
2007 Volume Price/Mix
Foreign
Exchange
Manufacturing
and Other Costs
Total net sales $ 2,987 -17.8% -18.6% -1.3% 2.1% n/a
Gross profit margin 21.8% -1.9pp n/a -2.1pp 0.3pp -0.1pp