Kodak 2008 Annual Report Download - page 168
Download and view the complete annual report
Please find page 168 of the 2008 Kodak annual report below. You can navigate through the pages in the report by either clicking on the pages listed below, or by using the keyword search tool below to find specific information within the annual report.-
 1
1 -
2
-
3
-
4
-
5
-
6
-
7
-
8
-
9
-
10
-
11
-
12
-
13
-
14
-
15
-
16
-
17
-
18
-
19
-
20
-
21
-
22
-
23
-
24
-
25
-
26
-
27
-
28
-
29
-
30
-
31
-
32
-
33
-
34
-
35
-
36
-
37
-
38
-
39
-
40
-
41
-
42
-
43
-
44
-
45
-
46
-
47
-
48
-
49
-
50
-
51
-
52
-
53
-
54
-
55
-
56
-
57
-
58
-
59
-
60
-
61
-
62
-
63
-
64
-
65
-
66
-
67
-
68
-
69
-
70
-
71
-
72
-
73
-
74
-
75
-
76
-
77
-
78
-
79
-
80
-
81
-
82
-
83
-
84
-
85
-
86
-
87
-
88
-
89
-
90
-
91
-
92
-
93
-
94
-
95
-
96
-
97
-
98
-
99
-
100
-
101
-
102
-
103
-
104
-
105
-
106
-
107
-
108
-
109
-
110
-
111
-
112
-
113
-
114
-
115
-
116
-
117
-
118
-
119
-
120
-
121
-
122
-
123
-
124
-
125
-
126
-
127
-
128
-
129
-
130
-
131
-
132
-
133
-
134
-
135
-
136
-
137
-
138
-
139
-
140
-
141
-
142
-
143
-
144
-
145
-
146
-
147
-
148
-
149
-
150
-
151
-
152
-
153
-
154
-
155
-
156
-
157
-
 158
158 -
 159
159 -
 160
160 -
 161
161 -
 162
162 -
 163
163 -
 164
164 -
 165
165 -
 166
166 -
 167
167 -
 168
168 -
 169
169 -
 170
170 -
 171
171 -
 172
172 -
 173
173 -
 174
174 -
 175
175 -
 176
176 -
 177
177 -
 178
178 -
179
-
180
-
181
-
182
-
183
-
184
-
185
-
186
-
187
-
188
-
189
-
190
-
191
-
192
-
193
-
194
-
195
-
196
-
197
-
198
-
199
-
200
-
201
-
202
-
203
-
204
-
205
-
206
-
207
-
208
-
209
-
210
-
211
-
212
-
213
-
214
-
215
-
216
 |
 |
42
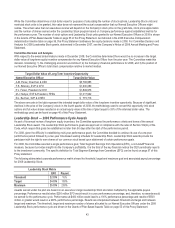
Mix of Long-Term Equity Incentive Compensation
The Committee has no pre-determined mix of the form of long-term equity incentives granted to our Named Executive Officers. In
December 2008, the Committee determined, based on the analysis discussed below, that the equity compensation program for 2009
would deliver:
• 50% of the equity dollar value in the form of stock options;
• 25% of the equity dollar value in the form of Leadership Stock; and
• 25% of the equity dollar value in the form of restricted stock units.
The stock options vest in substantially equal annual installments over a three-year period. Leadership Stock program awards are granted
in the form of performance stock units, which, if earned, are paid in the form of shares of common stock upon fulfilling a two-year vesting
period which follows a one-year performance period. The performance goals for the Leadership Stock program are established each year,
providing flexibility to the Committee to design a pay-for-performance plan that rewards achievement of key financial and/or operational
metrics. Awards delivered in restricted stock units are paid in the form of shares of common stock when the three-year vesting period
lapses.
Committee Decision and Analysis
In determining the annual mix of the form of long-term equity for 2009, the Committee considered the following:
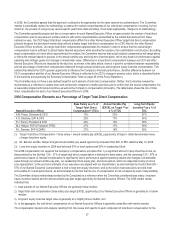
•Alignment with shareholders’ interests. The percentage of total direct compensation of our Named Executive Officers
delivered in the form of equity ranges from 55% - 67%. All three forms of long-term equity incentive compensation provided in
2009 (stock options, Leadership Stock, and restricted stock units) are either wholly or partially dependent on changes in share
price and, as such, support our shareholder alignment objective. The Committee recognized that stock options foster the
strongest linkage between changes in shareholder value and gains realized by our executives. Therefore, it assigned the
greatest percentage (50%) of the total equity mix to stock options. The Committee also recognized that stock options, especially
if used in isolation, can create windfalls in a rising market and may lead to gains even when operating performance is weak.
Conversely, in a declining market, it is possible for stock options to deliver little or no value even when operating performance is
strong. Stock options also create a fixed expense for the Company regardless of whether they actually deliver value to
executives and, therefore, create the possibility of incurring earnings charges for awards that may deliver little or no value. As
such, while stock options are the major form of equity compensation used for 2009, the Committee also used other awards, as
discussed below, to ensure balance in the overall program and to mitigate the impact that uncontrollable market volatility may
have on the pay realized by the Named Executive Officers.
•Retention and stock ownership. For 2009, the Committee introduced restricted stock units, with a three-year cliff vesting, as a
part of the long-term equity incentive mix. The Committee decided to introduce restricted stock units after a review of the Named
Executive Officer Tally Sheets. The Tally Sheets demonstrated that the existing outstanding equity awards held little intrinsic
value for our Named Executive Officers, even in the event of significant stock price appreciation, and therefore were not
effectively supporting the Company’s retention objectives. The introduction of restricted stock units, while limiting the upside
equity opportunity available through Leadership Stock, provides a time-based equity opportunity that is tied to stock price,
enhances stock ownership, and addresses retention. In determining the percentage of restricted stock units that should comprise
the incentive mix, the Committee sought the advice of its Consultant, who indicated that utilization of restricted stock units in the
recommended percentage (25%) was aligned with current general industry practice.
•Pay for performance. The Committee continued the use of Leadership Stock in the equity mix to link a meaningful portion of the
overall long-term incentive opportunity toward the delivery of key operating goals. This mix mitigates the impact of uncontrollable
market volatility on payouts while it strengthens the linkage between controllable performance and realized compensation. The
Committee determined a mix of 25% to be an appropriate weight, recognizing the volatility of the current economic environment
and the challenge it poses in establishing appropriate financial metrics. Leadership Stock is financially more efficient than stock
options and restricted stock units since the costs are incurred only if the underlying operating performance goals are achieved. In
addition, because Leadership Stock, like restricted stock units, is structured in whole shares (rather than just potential
appreciation in the value of underlying shares), it requires fewer shares to deliver a given level of value and thereby helps in the
management of potential share dilution (i.e., overhang).
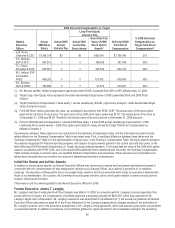
Determining Annual Target Allocations of Long-Term Equity Incentive Compensation
The number of stock options, Leadership Stock, and restricted stock units granted to the Named Executive Officers is calculated based on
a dollar value for each executive. This dollar-denominated value is set and intended to align target total direct compensation with
approximately the market median. The Committee reviews the dollar amount and, if appropriate, adjusts it to reflect individual performance
factors. The methodology used to convert this dollar-denominated long-term equity incentive opportunity into equity grants (stock options,
leadership stock units and restricted stock units) can be found on page 46 of this Proxy Statement. The equity grants are made in
accordance with the Board of Directors Policy on Equity Awards, discussed further on page 46 of this Proxy Statement.