Kodak 2008 Annual Report Download - page 105
Download and view the complete annual report
Please find page 105 of the 2008 Kodak annual report below. You can navigate through the pages in the report by either clicking on the pages listed below, or by using the keyword search tool below to find specific information within the annual report.-
 1
1 -
2
-
3
-
4
-
5
-
6
-
7
-
8
-
9
-
10
-
11
-
12
-
13
-
14
-
15
-
16
-
17
-
18
-
19
-
20
-
21
-
22
-
23
-
24
-
25
-
26
-
27
-
28
-
29
-
30
-
31
-
32
-
33
-
34
-
35
-
36
-
37
-
38
-
39
-
40
-
41
-
42
-
43
-
44
-
45
-
46
-
47
-
48
-
49
-
50
-
51
-
52
-
53
-
54
-
55
-
56
-
57
-
58
-
59
-
60
-
61
-
62
-
63
-
64
-
65
-
66
-
67
-
68
-
69
-
70
-
71
-
72
-
73
-
74
-
75
-
76
-
77
-
78
-
79
-
80
-
81
-
82
-
83
-
84
-
85
-
86
-
87
-
88
-
89
-
90
-
91
-
92
-
93
-
94
-
 95
95 -
 96
96 -
 97
97 -
 98
98 -
 99
99 -
 100
100 -
 101
101 -
 102
102 -
 103
103 -
 104
104 -
 105
105 -
 106
106 -
 107
107 -
 108
108 -
 109
109 -
 110
110 -
 111
111 -
 112
112 -
 113
113 -
 114
114 -
 115
115 -
116
-
117
-
118
-
119
-
120
-
121
-
122
-
123
-
124
-
125
-
126
-
127
-
128
-
129
-
130
-
131
-
132
-
133
-
134
-
135
-
136
-
137
-
138
-
139
-
140
-
141
-
142
-
143
-
144
-
145
-
146
-
147
-
148
-
149
-
150
-
151
-
152
-
153
-
154
-
155
-
156
-
157
-
158
-
159
-
160
-
161
-
162
-
163
-
164
-
165
-
166
-
167
-
168
-
169
-
170
-
171
-
172
-
173
-
174
-
175
-
176
-
177
-
178
-
179
-
180
-
181
-
182
-
183
-
184
-
185
-
186
-
187
-
188
-
189
-
190
-
191
-
192
-
193
-
194
-
195
-
196
-
197
-
198
-
199
-
200
-
201
-
202
-
203
-
204
-
205
-
206
-
207
-
208
-
209
-
210
-
211
-
212
-
213
-
214
-
215
-
216
 |
 |
103
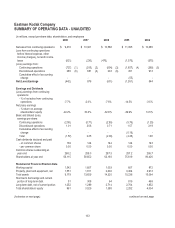
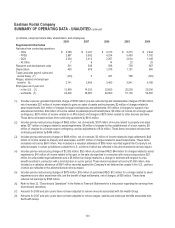
Eastman Kodak Company
SUMMARY OF OPERATING DATA - UNAUDITED
(in millions, except per share data, shareholders, and employees
2008 2007
2006
2005 2004
Net sales from continuing operations $ 9,416 $ 10,301
$ 10,568
$ 11,395 $ 10,665
Loss from continuing operations
before interest expense, other
income (charges), net and income
taxes (821) (230)
(476)
(1,073) (670)
(Loss) earnings from:
Continuing operations (727) (1) (205) (2)
(804)
(3) (1,657) (4) (369) (5)
Discontinued operations 285 (6) 881 (6)
203
(6) 451 913
Cumulative effect of accounting
change --
-
(55) -
Net (Loss) Earnings (442) 676
(601)
(1,261) 544
Earnings and Dividends
(Loss) earnings from continuing
operations
- % of net sales from continuing
operations -7.7% -2.0%
-7.6%
-14.5% -3.5%
Net (loss) earnings
- % return on average
shareholders' equity -22.2% 30.6%
-32.8%
-39.9% 14.5%
Basic and diluted (loss)
earnings per share:
Continuing operations (2.58) (0.71)
(2.80)
(5.76) (1.29)
Discontinued operations 1.01 3.06
0.71
1.57 3.19
Cumulative effect of accounting
change - -
-
(0.19) -
Total (1.57) 2.35
(2.09)
(4.38) 1.90
Cash dividends declared and paid
- on common shares 139 144
144
144 143
- per common share 0.50 0.50
0.50
0.50 0.50
Common shares outstanding at
year end 268.2 288.0
287.3
287.2 286.7
Shareholders at year end 56,115 58,652
63,193
75,619 80,426
Statement of Financial Position Data
Working capital 1,542 1,607
1,003
607 872
Property, plant and equipment, net 1,551 1,811
2,602
3,464 3,913
Total assets 9,179 13,659
14,320
15,236 15,084
Short-term borrowings and current
portion of long-term debt 51 308
64
819 469
Long-term debt, net of current portion 1,252 1,289
2,714
2,764 1,852
Total shareholders' equity 961 3,029
1,388
2,282 4,034
(footnotes on next page) continued on next page