Kodak 2008 Annual Report Download - page 169
Download and view the complete annual report
Please find page 169 of the 2008 Kodak annual report below. You can navigate through the pages in the report by either clicking on the pages listed below, or by using the keyword search tool below to find specific information within the annual report.-
 1
1 -
2
-
3
-
4
-
5
-
6
-
7
-
8
-
9
-
10
-
11
-
12
-
13
-
14
-
15
-
16
-
17
-
18
-
19
-
20
-
21
-
22
-
23
-
24
-
25
-
26
-
27
-
28
-
29
-
30
-
31
-
32
-
33
-
34
-
35
-
36
-
37
-
38
-
39
-
40
-
41
-
42
-
43
-
44
-
45
-
46
-
47
-
48
-
49
-
50
-
51
-
52
-
53
-
54
-
55
-
56
-
57
-
58
-
59
-
60
-
61
-
62
-
63
-
64
-
65
-
66
-
67
-
68
-
69
-
70
-
71
-
72
-
73
-
74
-
75
-
76
-
77
-
78
-
79
-
80
-
81
-
82
-
83
-
84
-
85
-
86
-
87
-
88
-
89
-
90
-
91
-
92
-
93
-
94
-
95
-
96
-
97
-
98
-
99
-
100
-
101
-
102
-
103
-
104
-
105
-
106
-
107
-
108
-
109
-
110
-
111
-
112
-
113
-
114
-
115
-
116
-
117
-
118
-
119
-
120
-
121
-
122
-
123
-
124
-
125
-
126
-
127
-
128
-
129
-
130
-
131
-
132
-
133
-
134
-
135
-
136
-
137
-
138
-
139
-
140
-
141
-
142
-
143
-
144
-
145
-
146
-
147
-
148
-
149
-
150
-
151
-
152
-
153
-
154
-
155
-
156
-
157
-
158
-
 159
159 -
 160
160 -
 161
161 -
 162
162 -
 163
163 -
 164
164 -
 165
165 -
 166
166 -
 167
167 -
 168
168 -
 169
169 -
 170
170 -
 171
171 -
 172
172 -
 173
173 -
 174
174 -
 175
175 -
 176
176 -
 177
177 -
 178
178 -
 179
179 -
180
-
181
-
182
-
183
-
184
-
185
-
186
-
187
-
188
-
189
-
190
-
191
-
192
-
193
-
194
-
195
-
196
-
197
-
198
-
199
-
200
-
201
-
202
-
203
-
204
-
205
-
206
-
207
-
208
-
209
-
210
-
211
-
212
-
213
-
214
-
215
-
216
 |
 |

43
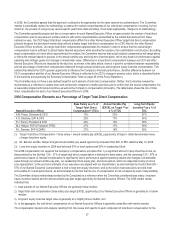
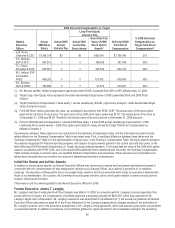
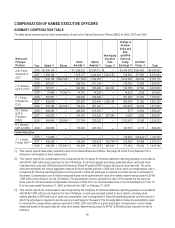
While the Committee determines a total dollar value for purposes of calculating the number of stock options, Leadership Stock units and
restricted stock units to be granted, this value does not represent the actual compensation that our Named Executive Officers might
realize. The actual value that our executives receive will depend on the Company’s stock price on the grant date, stock price appreciation
and the number of shares earned under the Leadership Stock program based on Company performance against established metrics for
the performance year. The number of stock options and Leadership Stock units granted to our Named Executive Officers in 2008 is shown
in the Grants of Plan-Based Awards Table on page 55 of this Proxy Statement. As indicated in the 2008 Executive Compensation
determination timeline table on page 36, this Proxy Statement addresses the equity decisions made in 2008. For Committee Decision and
Analysis for 2008 Leadership Stock grants, determined in December 2007, see the Company’s Notice of 2008 Annual Meeting and Proxy
Statement.
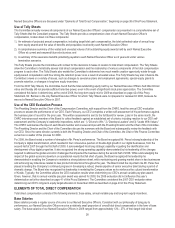
Committee Decision and Analysis
With respect to the award determinations made in December 2008, the Committee determined there would be no increase in the target
dollar value of long-term equity incentive compensation for any Named Executive Officer from the prior year. The Committee made this
decision considering: 1) the challenging economic environment; 2) the Company’s financial performance for 2008; and 3) the position of
our Named Executive Officer’s total direct compensation relative to market median.
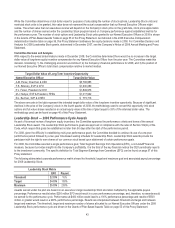
Target Dollar Value of Long-Term Incentive Opportunity
Named Executive Officer Target Dollar Value
A.M. Perez, Chairman & CEO $5,786,885
F.S. Sklarsky, EVP & CFO $1,600,080
P.J. Faraci, President & COO $1,899,978
M.J. Hellyar, EVP & President, FPEG $1,017,962
R.L. Berman, SVP & CHRO $ 775,716
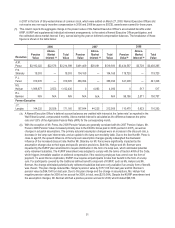
The above amounts in the table represent the intended target dollar value of the long-term incentive opportunity. Because of significant
declines in the price of the Company’s stock in the fourth quarter of 2008, the methodology used to convert this opportunity into stock
options and full value shares resulted in an actual equity value at the time of grant equal to 33% of the intended dollar value. The
methodology used can be found on page 46 of this Proxy Statement.
Leadership Stock — 2008 Performance Cycle Awards
As part of its annual review of long-term equity incentives, the Committee approves the performance criteria and terms of the annual
Leadership Stock award. The Leadership Stock performance goals are approved in compliance with the rules of Section 162(m) of the
Code, which require that goals be established no later than 90 days after the start of the performance period.
For 2008, given the difficulty in establishing multi-year performance goals, the Committee decided to continue its use of a one-year
performance period followed by a two-year time-based vesting schedule for Leadership Stock. Leadership Stock awards provide the
participant with the right to earn shares of our common stock based upon attainment of certain performance goals.
For 2008, the Committee selected a single performance goal, Total Segment Earnings from Operations (EFO), a non-GAAP financial
measure, because it provides insight into the Company’s profitability. It is the third of the key financial metrics the CEO periodically reports
to the investment community. The specific definition for Total Segment Earnings from Operations (EFO) can be found on page 57 of this
Proxy statement.
The following abbreviated corporate performance matrix shows the threshold, target and maximum goal and associated payout percentage
for 2008 Leadership Stock:
Leadership Stock Matrix
EFO Payout
Threshold $200M 10%
Target $400M 100%
Maximum $500M 200%
Awards earned under the plan are based on an executive’s target Leadership Stock allocation multiplied by the applicable payout
percentage. Performance results below $200 million EFO would result in a zero performance percentage, and, therefore, no awards would
be earned for the performance cycle. Performance at $400 million would lead to a 100% performance percentage and results of $500
million or greater would result in a 200% performance percentage. Results are interpolated between threshold and target and between
target and maximum. The threshold, target and maximum number of shares allocated to our Named Executive Officers under the 2008
Leadership Stock performance cycle are shown in the Grants of Plan-Based Awards Table on page 55 of this Proxy Statement.