Kodak 2008 Annual Report Download - page 59
Download and view the complete annual report
Please find page 59 of the 2008 Kodak annual report below. You can navigate through the pages in the report by either clicking on the pages listed below, or by using the keyword search tool below to find specific information within the annual report.-
 1
1 -
2
-
3
-
4
-
5
-
6
-
7
-
8
-
9
-
10
-
11
-
12
-
13
-
14
-
15
-
16
-
17
-
18
-
19
-
20
-
21
-
22
-
23
-
24
-
25
-
26
-
27
-
28
-
29
-
30
-
31
-
32
-
33
-
34
-
35
-
36
-
37
-
38
-
39
-
40
-
41
-
42
-
43
-
44
-
45
-
46
-
47
-
48
-
 49
49 -
 50
50 -
 51
51 -
 52
52 -
 53
53 -
 54
54 -
 55
55 -
 56
56 -
 57
57 -
 58
58 -
 59
59 -
 60
60 -
 61
61 -
 62
62 -
 63
63 -
 64
64 -
 65
65 -
 66
66 -
 67
67 -
 68
68 -
 69
69 -
70
-
71
-
72
-
73
-
74
-
75
-
76
-
77
-
78
-
79
-
80
-
81
-
82
-
83
-
84
-
85
-
86
-
87
-
88
-
89
-
90
-
91
-
92
-
93
-
94
-
95
-
96
-
97
-
98
-
99
-
100
-
101
-
102
-
103
-
104
-
105
-
106
-
107
-
108
-
109
-
110
-
111
-
112
-
113
-
114
-
115
-
116
-
117
-
118
-
119
-
120
-
121
-
122
-
123
-
124
-
125
-
126
-
127
-
128
-
129
-
130
-
131
-
132
-
133
-
134
-
135
-
136
-
137
-
138
-
139
-
140
-
141
-
142
-
143
-
144
-
145
-
146
-
147
-
148
-
149
-
150
-
151
-
152
-
153
-
154
-
155
-
156
-
157
-
158
-
159
-
160
-
161
-
162
-
163
-
164
-
165
-
166
-
167
-
168
-
169
-
170
-
171
-
172
-
173
-
174
-
175
-
176
-
177
-
178
-
179
-
180
-
181
-
182
-
183
-
184
-
185
-
186
-
187
-
188
-
189
-
190
-
191
-
192
-
193
-
194
-
195
-
196
-
197
-
198
-
199
-
200
-
201
-
202
-
203
-
204
-
205
-
206
-
207
-
208
-
209
-
210
-
211
-
212
-
213
-
214
-
215
-
216
 |
 |

57
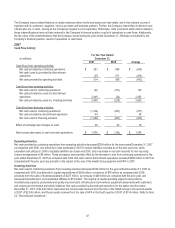
Eastman Kodak Company
CONSOLIDATED STATEMENT OF CASH FLOWS
(in millions)
For the Year Ended December 31,
2008 2007 2006
Cash flows from operating activities:
Net (loss) earnings $ (442) $ 676 $ (601)
Adjustments to reconcile to net cash provided by operating activities:
Earnings from discontinued operations, net of income taxes (285) (881) (203)
Depreciation and amortization 500 785 1,195
Gain on sales of businesses/assets (14) (157) (65)
Non-cash restructuring and rationalization costs, asset impairments and
other charges 801 336 138
Provision (benefit) for deferred income taxes 16 54 (168)
Decrease in receivables 148 161 163
(Increase) decrease in inventories (20) 108 292
(Decrease) increase in liabilities excluding borrowings (720) (624) 153
Other items, net (127) (107) (219)
Total adjustments 299 (325) 1,286
Net cash (used in) provided by continuing operations (143) 351 685
Net cash provided by (used in) discontinued operations 296 (37) 271
Net cash provided by operating activities 153 314 956
Cash flows from investing activities:
Additions to properties (254) (259) (335)
Proceeds from sales of businesses/assets 92 227 178
Acquisitions, net of cash acquired (38) (2) (3)
Investments in unconsolidated affiliates - - (19)
Marketable securities - sales 162 166 133
Marketable securities - purchases (150) (173) (135)
Net cash used in continuing operations (188)(41) (181)
Net cash provided by (used in) discontinued operations - 2,449 (44)
Net cash (used in) provided by investing activities (188) 2,408 (225)
Cash flows from financing activities:
Stock repurchases (301) - -
Proceeds from borrowings 155 177 765
Repayment of borrowings (446) (1,363) (1,568)
Dividends to shareholders (139) (144) (144)
Exercise of employee stock options - 6 -
Net cash used in continuing operations (731) (1,324) (947)
Net cash provided by discontinued operations - 44 -
Net cash used in financing activities (731) (1,280) (947)
Effect of exchange rate changes on cash (36) 36 20
Net (decrease) increase in cash and cash equivalents (802) 1,478 (196)
Cash and cash equivalents, beginning of year 2,947 1,469 1,665
Cash and cash equivalents, end of year $ 2,145 $ 2,947 $ 1,469