Kodak 2008 Annual Report Download - page 102
Download and view the complete annual report
Please find page 102 of the 2008 Kodak annual report below. You can navigate through the pages in the report by either clicking on the pages listed below, or by using the keyword search tool below to find specific information within the annual report.-
 1
1 -
2
-
3
-
4
-
5
-
6
-
7
-
8
-
9
-
10
-
11
-
12
-
13
-
14
-
15
-
16
-
17
-
18
-
19
-
20
-
21
-
22
-
23
-
24
-
25
-
26
-
27
-
28
-
29
-
30
-
31
-
32
-
33
-
34
-
35
-
36
-
37
-
38
-
39
-
40
-
41
-
42
-
43
-
44
-
45
-
46
-
47
-
48
-
49
-
50
-
51
-
52
-
53
-
54
-
55
-
56
-
57
-
58
-
59
-
60
-
61
-
62
-
63
-
64
-
65
-
66
-
67
-
68
-
69
-
70
-
71
-
72
-
73
-
74
-
75
-
76
-
77
-
78
-
79
-
80
-
81
-
82
-
83
-
84
-
85
-
86
-
87
-
88
-
89
-
90
-
91
-
 92
92 -
 93
93 -
 94
94 -
 95
95 -
 96
96 -
 97
97 -
 98
98 -
 99
99 -
 100
100 -
 101
101 -
 102
102 -
 103
103 -
 104
104 -
 105
105 -
 106
106 -
 107
107 -
 108
108 -
 109
109 -
 110
110 -
 111
111 -
 112
112 -
113
-
114
-
115
-
116
-
117
-
118
-
119
-
120
-
121
-
122
-
123
-
124
-
125
-
126
-
127
-
128
-
129
-
130
-
131
-
132
-
133
-
134
-
135
-
136
-
137
-
138
-
139
-
140
-
141
-
142
-
143
-
144
-
145
-
146
-
147
-
148
-
149
-
150
-
151
-
152
-
153
-
154
-
155
-
156
-
157
-
158
-
159
-
160
-
161
-
162
-
163
-
164
-
165
-
166
-
167
-
168
-
169
-
170
-
171
-
172
-
173
-
174
-
175
-
176
-
177
-
178
-
179
-
180
-
181
-
182
-
183
-
184
-
185
-
186
-
187
-
188
-
189
-
190
-
191
-
192
-
193
-
194
-
195
-
196
-
197
-
198
-
199
-
200
-
201
-
202
-
203
-
204
-
205
-
206
-
207
-
208
-
209
-
210
-
211
-
212
-
213
-
214
-
215
-
216
 |
 |

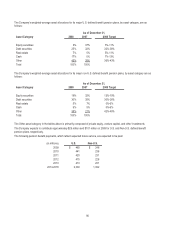
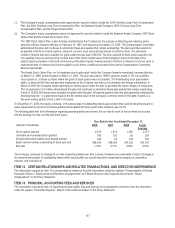
100
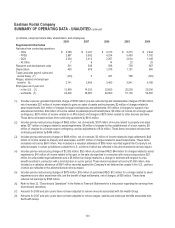
For the Year Ended December 31,
(in millions)
2008
2007 2006
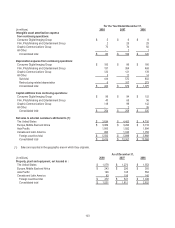
Intangible asset amortization expense
from continuing operations:
Consumer Digital Imaging Group
$5
$6$8
Film, Photofinishing and Entertainment Group
2
25 29
Graphic Communications Group
73
74 82
All Other
-
1 1
Consolidated total
$80
$ 106 $ 120
Depreciation expense from continuing operations:
Consumer Digital Imaging Group
$ 100
$ 86 $ 180
Film, Photofinishing and Entertainment Group
191
354 469
Graphic Communications Group
120
121 139
All Other
3
11 14
Sub-total
414
572 802
Restructuring-related depreciation
6
107 273
Consolidated total
$ 420
$ 679 $ 1,075
Capital additions from continuing operations:
Consumer Digital Imaging Group
$96
$ 94 $ 102
Film, Photofinishing and Entertainment Group
40
65 56
Graphic Communications Group
118
98 142
All Other
-
235
Consolidated total
$ 254
$ 259 $ 335
Net sales to external customers attributed to (1):
TheUnitedStates
$ 3,834
$ 4,403 $ 4,700
Europe, Middle East and Africa
$ 3,089
$ 3,264 $ 3,118
Asia Pacific
1,500
1,592 1,694
Canada and Latin America
993
1,042 1,056
Foreign countries total
$ 5,582
$ 5,898 $ 5,868
Consolidated total
$ 9,416
$ 10,301 $ 10,568
(1) Sales are reported in the geographic area in which they originate.
As of December 31,
(in millions)
2008
2007 2006
Property, plant and equipment, net located in :
TheUnitedStates
$ 1,079
$ 1,270 $ 1,553
Europe, Middle East and Africa
$ 243
$ 290 $ 355
Asia Pacific
146
145 554
Canada and Latin America
83
106 140
Foreign countries total
$ 472
$ 541 $ 1,049
Consolidated total
$ 1,551
$ 1,811 $ 2,602