Kodak 2008 Annual Report Download - page 163
Download and view the complete annual report
Please find page 163 of the 2008 Kodak annual report below. You can navigate through the pages in the report by either clicking on the pages listed below, or by using the keyword search tool below to find specific information within the annual report.-
 1
1 -
2
-
3
-
4
-
5
-
6
-
7
-
8
-
9
-
10
-
11
-
12
-
13
-
14
-
15
-
16
-
17
-
18
-
19
-
20
-
21
-
22
-
23
-
24
-
25
-
26
-
27
-
28
-
29
-
30
-
31
-
32
-
33
-
34
-
35
-
36
-
37
-
38
-
39
-
40
-
41
-
42
-
43
-
44
-
45
-
46
-
47
-
48
-
49
-
50
-
51
-
52
-
53
-
54
-
55
-
56
-
57
-
58
-
59
-
60
-
61
-
62
-
63
-
64
-
65
-
66
-
67
-
68
-
69
-
70
-
71
-
72
-
73
-
74
-
75
-
76
-
77
-
78
-
79
-
80
-
81
-
82
-
83
-
84
-
85
-
86
-
87
-
88
-
89
-
90
-
91
-
92
-
93
-
94
-
95
-
96
-
97
-
98
-
99
-
100
-
101
-
102
-
103
-
104
-
105
-
106
-
107
-
108
-
109
-
110
-
111
-
112
-
113
-
114
-
115
-
116
-
117
-
118
-
119
-
120
-
121
-
122
-
123
-
124
-
125
-
126
-
127
-
128
-
129
-
130
-
131
-
132
-
133
-
134
-
135
-
136
-
137
-
138
-
139
-
140
-
141
-
142
-
143
-
144
-
145
-
146
-
147
-
148
-
149
-
150
-
151
-
152
-
 153
153 -
 154
154 -
 155
155 -
 156
156 -
 157
157 -
 158
158 -
 159
159 -
 160
160 -
 161
161 -
 162
162 -
 163
163 -
 164
164 -
 165
165 -
 166
166 -
 167
167 -
 168
168 -
 169
169 -
 170
170 -
 171
171 -
 172
172 -
 173
173 -
174
-
175
-
176
-
177
-
178
-
179
-
180
-
181
-
182
-
183
-
184
-
185
-
186
-
187
-
188
-
189
-
190
-
191
-
192
-
193
-
194
-
195
-
196
-
197
-
198
-
199
-
200
-
201
-
202
-
203
-
204
-
205
-
206
-
207
-
208
-
209
-
210
-
211
-
212
-
213
-
214
-
215
-
216
 |
 |

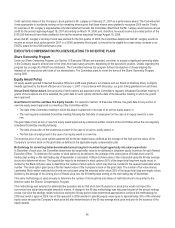
37
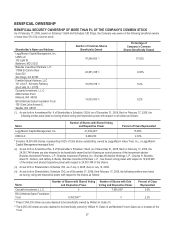
In 2008, the Committee agreed that this approach continued to be appropriate for the same reasons as outlined above. The Committee
intends to periodically review the methodology to assess the market competitiveness of our total direct compensation, including, but not
limited to, the process of using survey versus specific peer frame data and adopt, if and when appropriate, changes to its methodology.
The Committee generally targets total direct compensation for each Named Executive Officer at approximately the median of total direct
compensation paid to executives in similar positions with similar responsibilities as identified by the market data derived from these
national surveys. Our CEO target total direct compensation differs from other Named Executive Officer target total direct compensation
primarily because the benchmark market data reflects a higher target total direct compensation for a CEO than for the other Named
Executive Officer positions. Our target total direct compensation approximates the median in order to ensure that the overall target
compensation level is sufficient to attract highly talented executives while avoiding the creation of an unaffordable cost structure. By setting
target compensation at a level which approximates the median, the Committee ensures that actual realized compensation will range above
or below the median based on payouts in the annual variable pay and long-term incentive plans, which vary based on performance against
operating and strategic goals and changes in shareholder value. Differences in actual direct compensation between our CEO and other
Named Executive Officers are impacted by the fact that, as shown in the table below, there is a positive correlation between responsibility
and the percentage of total direct compensation delivered through annual variable pay and long-term equity incentive compensation. This
relationship reflects the CEO’s greater opportunity to influence the Company’s financial performance. (Another difference between our
CEO compensation and that of our Named Executive Officers is reflected in the CEO’s change in pension value, which is described further
in the narrative accompanying the Summary Compensation Table on page 49 of this Proxy Statement.)
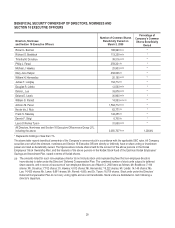
The Committee does not have a pre-defined target for each element of total direct compensation. Rather, the Committee reviews the
market data as a reference to assess how each component compares to market practices and to confirm that the overall compensation mix
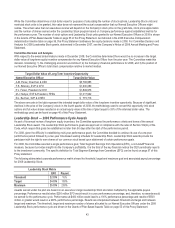
is reasonably aligned with market practices as well as the Company’s compensation philosophy. The table below shows the mix of total
direct compensation for each of our Named Executive Officers in 2008.
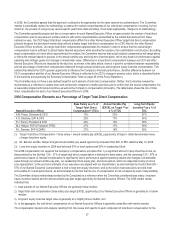
2008 Compensation Elements as a Percentage of Target Total Direct Compensation
(1) Target Total Direct Compensation = base salary + annual variable pay (EXCEL) opportunity at target + dollar-denominated value
of target long-term equity.
(2) Mr. Berman and Ms. Hellyar’s target annual variable pay award opportunity increased from 62% to 65% effective May 12, 2008.
(3) Long-term equity incentive in 2008 was delivered 50% in stock options and 50% in Leadership Stock.
The 2008 compensation mix supports the Company’s compensation principles that: 1) a significant amount of pay should be at risk, as
demonstrated by the fact that 13% - 27% of target total direct compensation is delivered in base salary, and the remaining 73% - 87% is
performance based; 2) realized compensation is significantly tied to performance against operating results and changes in shareholder
value through our annual variable pay plan, our Leadership Stock equity plan, and stock options, which are dependent solely on stock
price appreciation; 3) the economic interests of our executives are aligned with our shareholders, as demonstrated by the fact that 55% -
67% of our Named Executive Compensation is tied to long-term equity incentives; and 4) the senior-most executives are held most
accountable for overall performance, as demonstrated by the fact that the mix of compensation at risk increases by level of responsibility.
The Committee utilized market data provided by the Consultant as a reference when the Committee considered base salary, long-term
equity incentive awards and the annual variable pay plan target opportunity for Named Executive Officers. The 2008 market review
indicated that:
1) base salaries of our Named Executive Officers are generally below median;
2) target total cash compensation (base salary plus target EXCEL opportunity) of our Named Executive Officers is generally at or below
median;
3) long-term equity incentive target value is generally at or slightly above median; and
4) in the aggregate, the total direct compensation of our Named Executive Officers is generally competitive with market median.
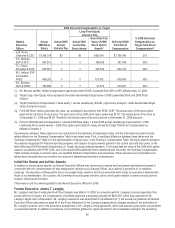
The compensation decision and analysis resulting from this review and specific to each component of total direct compensation for the
Named Executive Officer
Base Salary as a % of
Target Total Direct
Compensation(1) (TDC)
Annual Variable Pay
(EXCEL) at Target (2) as
a % of TDC
Long-Term Equity
Incentive(3) asa%of
TDC
A.M. Perez, Chairman & CEO 13% 20% 67%
F.S. Sklarsky, EVP & CFO 23% 17% 60%
P.J. Faraci, President & COO 22% 19% 59%
M.J. Hellyar, EVP & President, FPEG 27% 17% 56%
R.L. Berman, SVP & CHRO 27% 18% 55%